HiLoBands_v1
Download script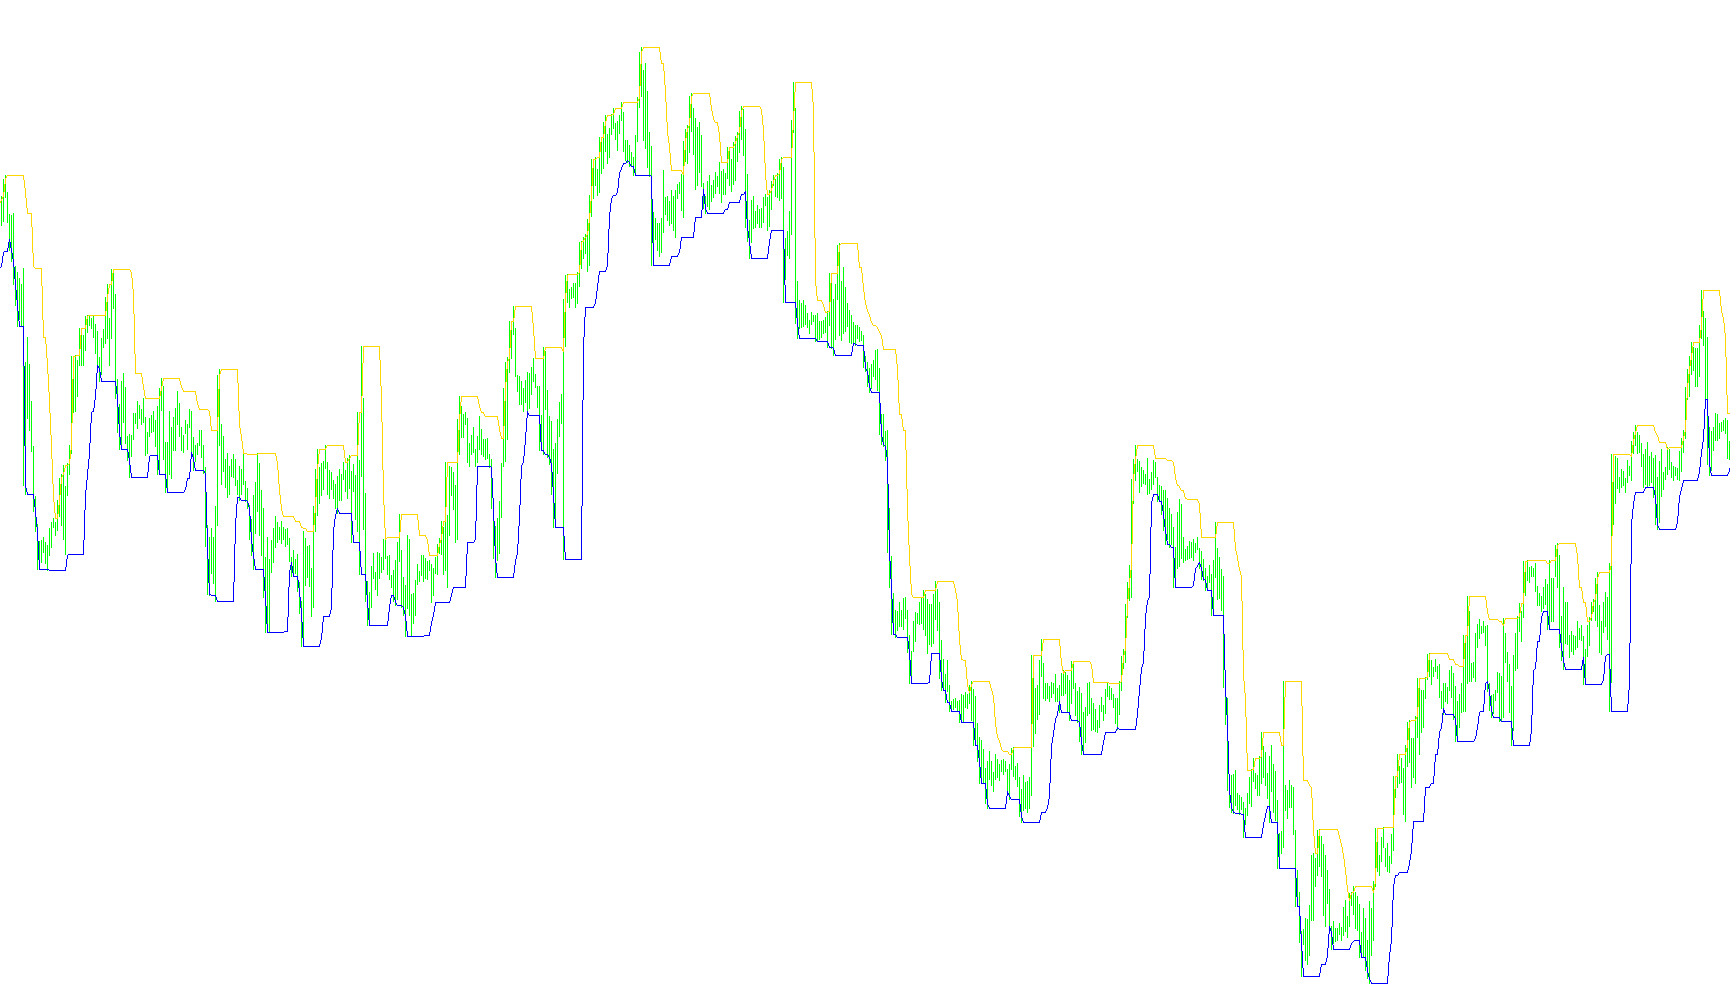
This tool is designed to provide a visual representation of market volatility and price boundaries by identifying key highs and lows within specific historical windows. Instead of looking at every single price tick, the logic focuses on establishing "boundary lines" that help traders understand the recent range of price movement.
Core Logic and Mechanics
The script operates based on a "rolling look-back" system. Here is how it processes market data:
1. Dynamic Range Identification The indicator scans the preceding price action to find the highest point reached and the lowest point touched within a specific timeframe (defined by the user). By looking back at these recent peaks and troughs, the tool identifies the "envelope" of current market activity.
2. Boundary Mapping For every point on the chart, the script calculates:
- The Upper Bound: The highest price reached in the immediate past.
- The Lower Bound: The lowest price reached in the immediate past.
By plotting these two values as continuous lines, the indicator creates a visual channel. This allows users to see at a glance how much "room" the market has moved in recently and where the significant historical extremes lie.
3. Smoothing and Continuity The logic ensures that as new price data enters the chart, the boundaries update dynamically. It prioritizes the most recent history to ensure that the lines reflect current market sentiment while maintaining a connection to past price levels. This prevents the visual representation from becoming erratic, providing a cleaner view of the market's reach.
How it Benefits the User
Rather than overwhelming a trader with every minor fluctuation in price, this logic filters out the "noise" and highlights the structural limits of the market. It allows a user to see:
- The extreme high and low territory established over the last few candles.
- The expansion or contraction of the current trading range.
- A clear visual "ceiling" and "floor" based on actual price history rather than theoretical calculations.
/*-----------------------------+
|			       |
| Shared by www.Aptrafx.com    |
|			       |
+------------------------------*/

//+------------------------------------------------------------------+
//|
//|
//+------------------------------------------------------------------+
#property copyright "PowerLawMBK Matt Kennel TRADE SECRET"
#property link      ""

#property indicator_chart_window
#property indicator_buffers 2

#property indicator_color1 White
#property indicator_color2 Aqua
#property indicator_color3 Aqua
#property indicator_color4 Orange
#property indicator_color5 Orange


//---- input parameters
//
//
// Modified by MBK
// try on M30 chart with these parameters.  Smaller and larger time frames
// appear to have too much chop
//


extern int CountBars=4000;

extern int bandlen=9;
int counter=0;
//---- buffers


double highline[],lowline[];
double highline2[],lowline2[];

//+------------------------------------------------------------------+
//| Custom indicator initialization function                         |
//+------------------------------------------------------------------+
int init()
  {
   string short_name;
//---- indicator line
   IndicatorBuffers(4);
   SetIndexStyle(0,DRAW_LINE);
   SetIndexStyle(1,DRAW_LINE);
   SetIndexBuffer(0,highline);
   SetIndexBuffer(1,lowline);
/*
   SetIndexStyle(2,DRAW_LINE);
   SetIndexStyle(3,DRAW_LINE);
   SetIndexBuffer(2,highline2);
   SetIndexBuffer(3,lowline2);
*/
//----
   return(0);
  }


//+------------------------------------------------------------------+
//| SilverTrend_PowerLaw                                             |
//+------------------------------------------------------------------+
int start()
  {
   CountBars = MathMin(Bars-bandlen-1,CountBars);

   int i,shift,counted_bars=IndicatorCounted();
   int i1,i2;
   int limit;
//----

//----
   if (counted_bars<0) return(-1);
   if (counted_bars>0) counted_bars--;


   limit = CountBars; // -counted_bars;
   if (limit < 1) limit = 1;
   ArrayResize(highline,limit);
   ArrayResize(lowline,limit);

   for (shift = limit; shift>=0; shift--)
   {
      double center, highweighted, lowweighted,range;

      // collect running highs and lows back in time.
      // high[k] means the highest high in the previous 'k' timesteps,
      // starting at shift.  Therefore high[k] must be monotonically increasing
      // as low[k] is monotonically decreasing.
      //
      int offset = 1;
      // for offset = 1 start computing using previous bar's data only, this may be
      // needed for causality if using a trading system
      double H1,L1;
      double H2,L2;

      H1 = High[Highest(Symbol(),0,MODE_HIGH,bandlen,shift+offset)];
      L1 = Low[Lowest(Symbol(),0,MODE_LOW,bandlen,shift+offset)];
      highline[shift] = H1;
      lowline[shift] = L1;
      // now do it manually
      /* H2 = High[shift+offset];
      L2 = Low[shift+offset];
      for (int k=1; k < bandlen; k++) {
         double HV = High[shift+k+offset];
         if (HV > H2) H2 = HV;
         //L2 = MathMin(L2,iLow(Symbol(),0,shift+k+offset));
         double LV = Low[shift+k+offset];
         if (LV < L2) L2 = LV;
      }
      highline2[shift] = H2;
      lowline2[shift] = L2;
      */
    }

    //for (shift = limit; shift >= 0; shift--) {
 //     if (shift < CountBars-SmoothingLength-1) {
 //        smoothed[shift] = iMAOnArray(centerline,0,SmoothingLength,ma_shift,MODE_SMA,shift);
//         smoothedhigh[shift] = smoothed[shift] + range/2*WidthPCT/100;
//         smoothedlow[shift] = smoothed[shift]- range/2*WidthPCT/100;
//
//      } else
//         smoothed[shift] = 0.0;
//
//   }
   return(0);
}
//+------------------------------------------------------------------+
Comments