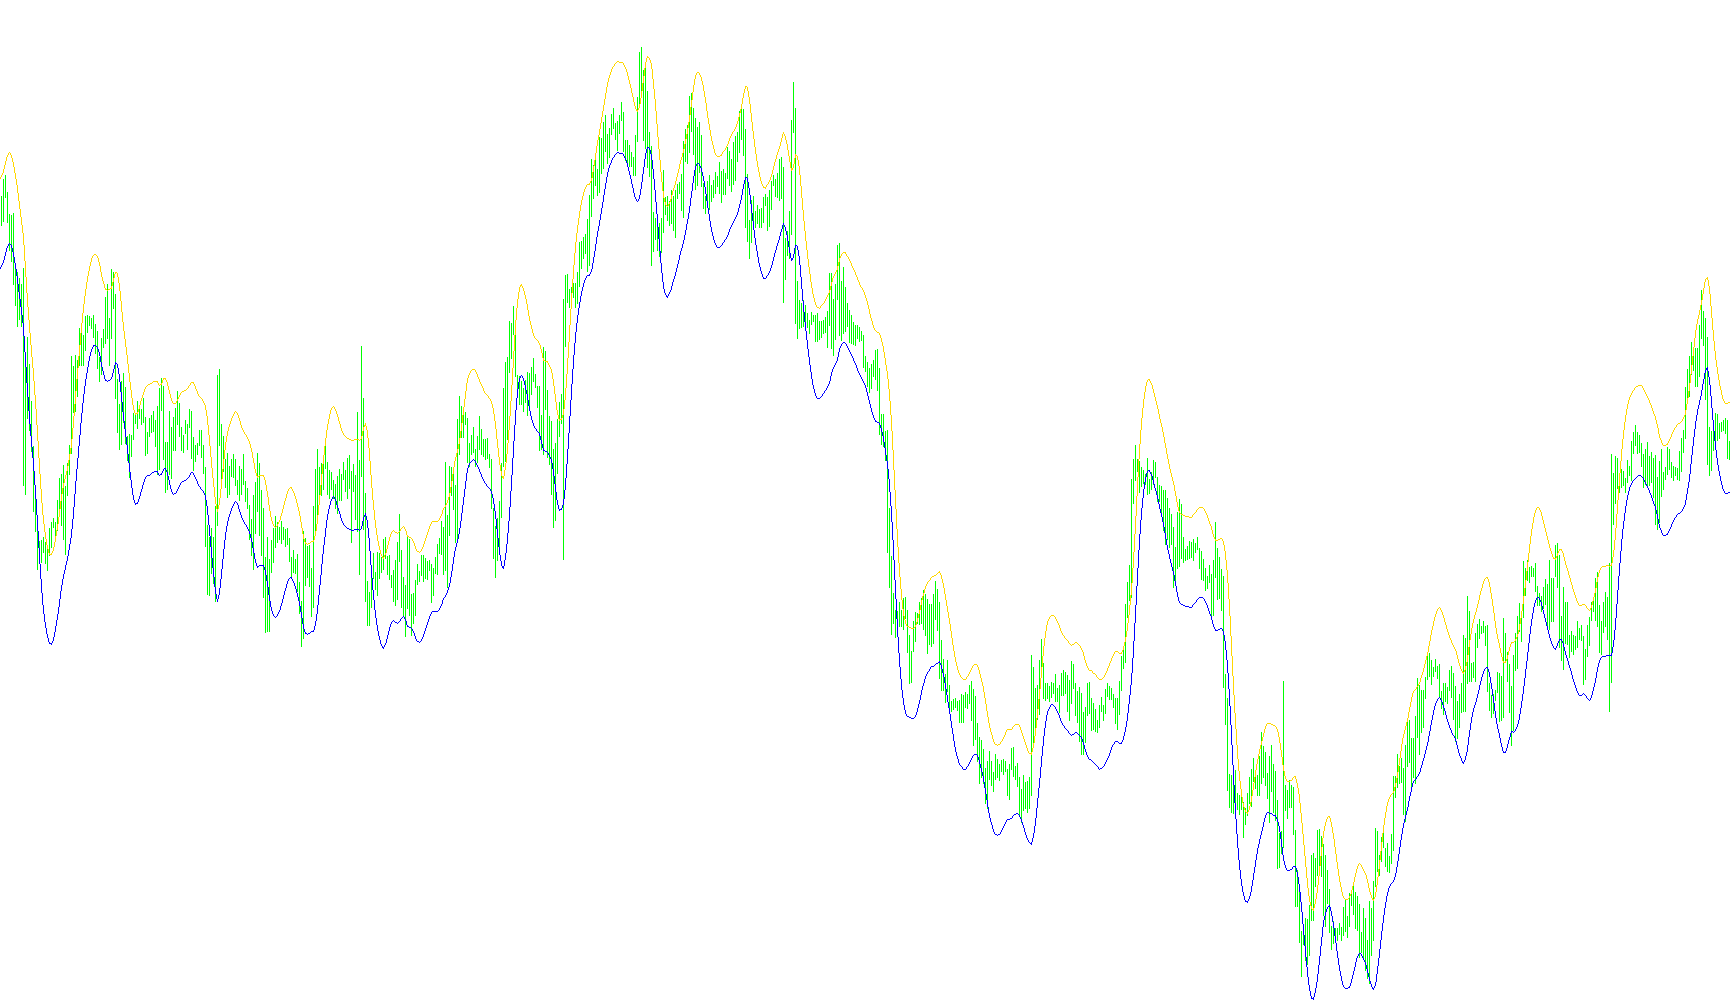
This script is a custom technical analysis tool designed for the MetaTrader platform. It identifies market trends and price volatility by calculating a specialized "envelope" based on two distinct types of moving averages.
Core Logic Overview
The tool operates by processing historical price data to create a smoothed trend line, which is then extended by a specific percentage to create an outer boundary. This boundary helps traders visualize the "normal" range of price movement relative to its current momentum.
Step-by-Step Breakdown
1. Data Input Selection The script begins by looking at specific price points on the chart (such as the Opening, Closing, High, or Low prices). It allows for two different price sources to be monitored simultaneously, providing a more comprehensive view of market activity.
2. The Moving Average Calculation To determine the trend, the tool uses a "Hull Moving Average" logic. Unlike standard moving averages that can be slow to react, this method uses a multi-step calculation:
- It calculates two separate Weighted Moving Averages (WMA) for each price source—one using the full period and one using half of that period.
- It then combines these two values mathematically to create a faster, smoother trend line that attempts to reduce "lag" (the delay between a price change and the indicator's reaction).
3. Final Smoothing and Envelope Creation Once the initial trend lines are established, the script applies a final smoothing layer using a square root calculation of the period. This results in a very fluid and responsive line that follows the price closely without being erratic.
Finally, the tool generates two specific boundaries (the "Envelope"):
- Upper Boundary: It takes the smoothed trend line and adds a small percentage of deviation to it.
- Lower Boundary: It takes the smoothed trend line and subtracts that same percentage.
Visual Interpretation
On your trading chart, this creates a "channel" or "ribbon." The center represents the core momentum of the market, while the upper and lower lines represent the limits of that momentum based on your chosen deviation settings. Traders typically use these boundaries to identify overextended price action or to confirm the strength of a current trend.
//+------------------------------------------------------------------+
//|                                                 HMA envelope.mq4 |
//|                                  Nick Bilak, beluck[AT]gmail.com |
//+------------------------------------------------------------------+
#property copyright "Copyright © 2006, Nick Bilak"
#property link      "http://www.mql4.info"

#property indicator_chart_window
#property indicator_buffers 2

#property indicator_color1 Red
#property indicator_color2 Red

//---- External parameters
extern int _maPeriod=20;
extern double deviation = 0.1;
extern int price1 = PRICE_OPEN;
int price1shift = 0;
int price2shift = 0;
extern int price2 = PRICE_OPEN;
/*
PRICE_CLOSE 0 Close price.
PRICE_OPEN 1 Open price.
PRICE_HIGH 2 High price.
PRICE_LOW 3 Low price.
PRICE_MEDIAN 4 Median price, (high+low)/2.
PRICE_TYPICAL 5 Typical price, (high+low+close)/3.
PRICE_WEIGHTED 6 Weighted close price, (high+low+close+close)/4.
*/

//---- indicator buffers
double _hma[],_wma[],hma[],wma[],b1[],b2[];

//----
int ExtCountedBars=0;

//+------------------------------------------------------------------+
//| Custom indicator initialization function                         |
//+------------------------------------------------------------------+
int init() {
   if (price1!=PRICE_OPEN) price1shift = 1;
   if (price2!=PRICE_OPEN) price2shift = 1;

	int    draw_begin;
	string short_name;
	IndicatorBuffers(6);

	//---- indicator buffers mapping
	SetIndexBuffer(0, b1);
	SetIndexStyle(0, DRAW_LINE);
	SetIndexEmptyValue(0, 0.0);
	SetIndexBuffer(1, b2);
	SetIndexStyle(1, DRAW_LINE);
	SetIndexEmptyValue(1, 0.0);
	SetIndexBuffer(2, _hma);
	SetIndexEmptyValue(2, 0.0);
	SetIndexBuffer(3, _wma);
	SetIndexEmptyValue(3, 0.0);
	SetIndexBuffer(4, hma);
	SetIndexEmptyValue(4, 0.0);
	SetIndexBuffer(5, wma);
	SetIndexEmptyValue(5, 0.0);

	IndicatorDigits(Digits);

	//---- initialization done
	return(0);
}

int start() {
	int i, shift, countedBars=IndicatorCounted();
	int maxBars=_maPeriod*2;
	int period=_maPeriod;
	double sqrtPeriod = MathSqrt(period*1.00);
	int halfPeriod=period/2;

	if(Bars<_maPeriod) return(-1);
   if(countedBars == 0) countedBars = maxBars;
	int limit=Bars-countedBars+maxBars;
	//---- moving average
	double wma1,_wma1;
	double wma2,_wma2;
	for(i=limit; i>=0; i--) {
	  _wma1 = iMA(Symbol(), 0, period, 0, MODE_LWMA, price1, i+price1shift);
	  _wma2 = iMA(Symbol(), 0, halfPeriod, 0, MODE_LWMA, price1, i+price1shift);
	  _wma[i] = 2.0*_wma2-_wma1;
	  wma1 = iMA(Symbol(), 0, period, 0, MODE_LWMA, price2, i+price2shift);
	  wma2 = iMA(Symbol(), 0, halfPeriod, 0, MODE_LWMA, price2, i+price2shift);
	  wma[i] = 2.0*wma2-wma1;
	}

	for(i=limit; i>=0; i--) {
	  _hma[i]=iMAOnArray(_wma, 0, sqrtPeriod, 0, MODE_LWMA, i);
	  hma[i]=iMAOnArray(wma, 0, sqrtPeriod, 0, MODE_LWMA, i);
	  b1[i]=_hma[i]+_hma[i]*deviation/100.0;
	  b2[i]=hma[i]-hma[i]*deviation/100.0;
	}

	return(0);
}
Comments