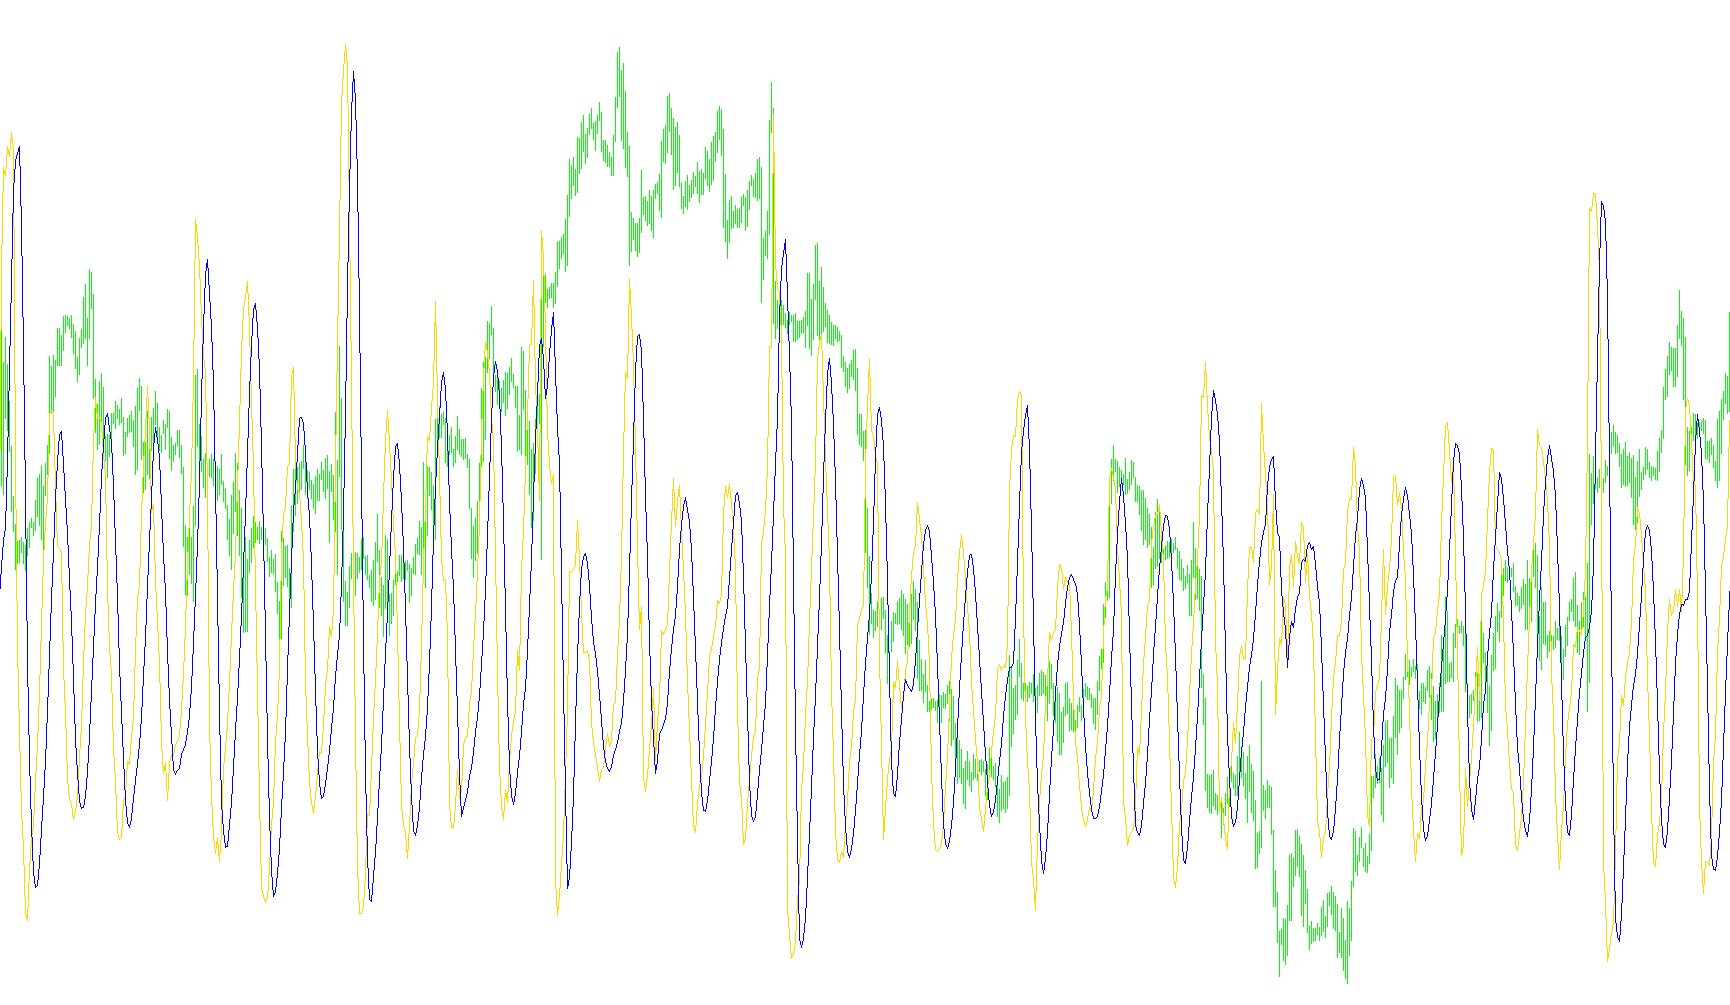
This script is designed as a custom technical analysis tool for the MetaTrader platform, specifically engineered to provide traders with a smoother and more responsive view of market volatility. Rather than showing raw price fluctuations, it focuses on analyzing the "Average True Range" (ATR)—a standard metric used to measure how much an asset moves on average over a specific timeframe.
Core Logic Overview
The tool operates through a two-stage calculation process to filter out market "noise" and highlight significant trends in volatility.
1. The Volatility Smoothing Phase The first step of the logic takes the standard Average True Range and applies a mathematical formula inspired by the "Hull" moving average style. By combining different timeframes of volatility data (specifically looking at a half-period calculation against a full period), the script creates a primary volatility line. This approach is intended to reduce the lag typically found in standard indicators, allowing the visual representation to react more quickly to sudden changes in market activity while remaining smooth.
2. The Signal Refinement Phase Once the primary volatility data is processed, the script performs a second layer of calculation. It takes that smoothed volatility and applies a "Moving Average" to it. This creates a secondary signal line. By layering a moving average over the already-smoothed volatility data, the tool provides a high-level view of the market's current state.
Visual Representation
The script produces two distinct lines on a separate window below your price chart:
- The Primary Line (Hull_ATR): Represents the immediate, smoothed volatility of the market.
- The Signal Line: Represents a longer-term trend of that volatility.
How it Benefits the Trader
By focusing on "Volatility Trends" rather than just price direction, this script helps traders identify periods of high activity versus periods of consolidation. Because it utilizes a specialized smoothing logic (Hull Style), it aims to provide a clearer picture of market momentum with less "jitter" than standard volatility indicators, helping users distinguish between minor price fluctuations and meaningful shifts in market energy.
/*-----------------------------+
|			       |
| Shared by www.Aptrafx.com    |
|			       |
+------------------------------*/

//+------------------------------------------------------------------+
//|                                               Hull_Style_ATR.mq4 |
//+------------------------------------------------------------------+

//---- indicator settings

#property  indicator_separate_window

#property  indicator_buffers 2

#property  indicator_color1  LightSeaGreen

#property  indicator_color2  Purple

//---- indicator parameters

extern int ATR_Period          = 14;
extern int SignalLine_Period   = 21;
extern int SignalLineShift     =  3;
extern int SignalLineMa_Method =  0; // 0 SMA , 1 EMA , 2 SMMA , 3 LWMA

//---- indicator buffers

double preatrbuffer[];
double finalatrbuffer[];

int    draw_begin0;

//+------------------------------------------------------------------+
//| Custom indicator initialization function                         |
//+------------------------------------------------------------------+

int init()
 {

//---- indicator buffers mapping

//---- drawing settings

  draw_begin0 = ATR_Period+MathFloor(MathSqrt(ATR_Period));

  SetIndexEmptyValue(0,0.0000);
  SetIndexStyle(0,DRAW_LINE,STYLE_SOLID,1);
  SetIndexBuffer(0,preatrbuffer);
  SetIndexLabel(0,"Hull_ATR");
  SetIndexDrawBegin(0,draw_begin0);

  SetIndexEmptyValue(1,0.0000);
  SetIndexStyle(1,DRAW_LINE,STYLE_SOLID,1);
  SetIndexBuffer(1,finalatrbuffer);
  SetIndexLabel(1," ("+SignalLine_Period+") Period Ma of Hull_ATR");
  SetIndexDrawBegin(1,draw_begin0);


//---- name for DataWindow and indicator subwindow label

  IndicatorShortName("Hull_Style_ATR("+ATR_Period+")");


//---- initialization done
  return(0);
 }

//+------------------------------------------------------------------+
//|                                                                  |
//+------------------------------------------------------------------+

int start()
 {
  int limit,i,shift;
  int counted_bars=IndicatorCounted();

//---- check for possible errors
  if(counted_bars<1)
   {
     for(i=1;i<=draw_begin0;i++) { finalatrbuffer[Bars-i]=0; preatrbuffer[Bars-i]=0; }
   }

//---- last counted bar will be recounted
  if(counted_bars>0) counted_bars--;
  limit=Bars-counted_bars;

//-----------------------------------------------------------------------------------------------------------------

//---- preadxbuffer

  for(i=0; i<limit; i++)
    { preatrbuffer[i] = (iATR(Symbol(), 0, MathFloor(ATR_Period/2), i)*2) - iATR(Symbol(), 0, ATR_Period, i); }

//---- finaladxbuffer

  for(i=0; i<limit; i++)
    { finalatrbuffer[i]=iMAOnArray(preatrbuffer,0,MathFloor(MathSqrt(SignalLine_Period)),SignalLineShift,SignalLineMa_Method,i); }

//-----------------------------------------------------------------------------------------------------------------

//---- done
  return(0);
 }
Comments