i_daybb_v1_1
Download script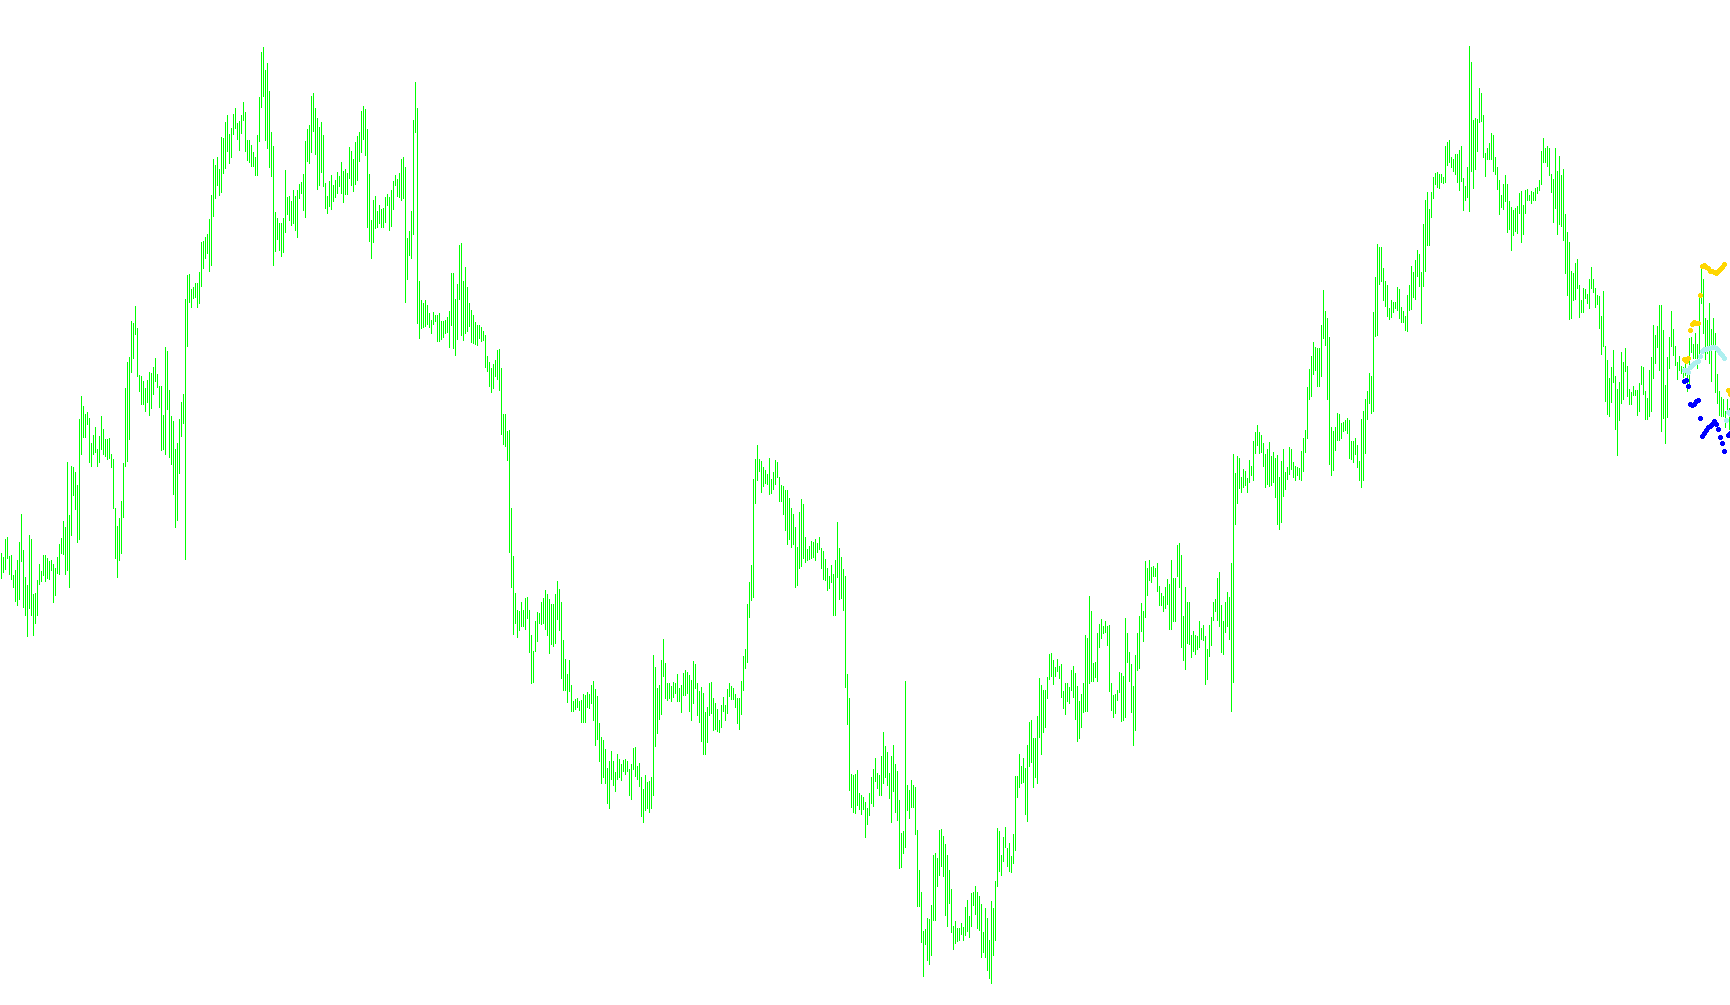
This tool is designed as a technical analysis indicator for the MetaTrader platform. Its primary purpose is to visualize specific market boundaries—known as Bollinger Bands—while dynamically adjusting how it calculates the underlying data based on the timeframes you are viewing.
Core Functionality
The indicator identifies three distinct price levels on your chart: an upper boundary, a lower boundary, and a trungle average line. These lines help traders identify periods of high volatility (when prices move far outside the bands) or consolidation (when prices stay within them).
Key Logic Features
-
Dynamic Timeframe Awareness: The script includes a built-in safeguard to ensure it only functions on shorter timeframes (specifically, anything more granular than a Daily chart). If you try to run this on a timeframe that is too large, the tool will alert you, as its logic is optimized for intraday movements.
-
Automatic Bar Counting: Instead of using a fixed number of candles to calculate the average price, the script intelligently "counts" how many bars occur within a single day. It looks back through the history to determine how many price points exist in a 24-hour window based on your current chart settings.
-
Multi-Day Calculation Window: The logic is programmed to look back over a specific number of days (defaulting to two) to calculate its boundaries. By looking at a rolling window of time rather than just a raw number of candles, the indicator provides a more consistent view of market volatility regardless of whether you are viewing the chart in minutes, hours, or sessions.
-
Visual Output: The results are plotted directly onto your trading window as three separate lines. These represent:
- Bands Upper: The ceiling of the current price range.
- Bands Lower: The floor of the current price range.
- Bands Average: The central trend line around which the price fluctuates.
Summary for the User
Essentially, this tool automates the complex math of calculating Bollinger Bands by ensuring that "one day" of data is always accounted for correctly, whether your chart is moving fast or slow. It provides a cleaner, more accurate representation of market extremes based on daily cycles.
//+------------------------------------------------------------------+
//|                                                        DayBB.mq4 |
//|                                 Copyright 2010-2015, Excstrategy |
//|                                        http://www.ExcStrategy.ru |
//+------------------------------------------------------------------+
#property copyright "ExcStrategy"
#property link      "http://www.ExcStrategy.ru"
#property version   "1.1"
#property description "Bollinger bands"
#property strict
//+------------------------------------------------------------------+
#property indicator_chart_window
#property indicator_buffers 3
#property indicator_color1 Lime
#property indicator_width1 1
#property indicator_color2 Red
#property indicator_width2 1
#property indicator_color3 Magenta
#property indicator_width3 1
//---- input parameters
extern double Deviation= 3;
extern int Bands_shift = 1;
extern int Applied_price=0;
//----
extern int DaysForCalculation=2;
//---- buffers
double BufferHigh1[];
double BufferLow1[];
double BufferHigh2[];
//+------------------------------------------------------------------+
//|                                                                  |
//+------------------------------------------------------------------+
int init()
  {
   IndicatorBuffers(3);
//---- indicator lines
   SetIndexStyle(0,DRAW_ARROW);
   SetIndexBuffer(0,BufferHigh1);
   SetIndexStyle(1,DRAW_ARROW);
   SetIndexBuffer(1,BufferLow1);
   SetIndexStyle(2,DRAW_ARROW);
   SetIndexBuffer(2,BufferHigh2);
//----
   SetIndexArrow(0,159);
   SetIndexArrow(1,159);
   SetIndexArrow(2,159);
//----
   SetIndexLabel(0,"Bands Upper");
   SetIndexLabel(1,"Bands Lower");
   SetIndexLabel(2,"Bands Average");
//----
   DaysForCalculation=DaysForCalculation+1;
//----
   return(0);
  }
//+------------------------------------------------------------------+
//|                                                                  |
//+------------------------------------------------------------------+
int start()
  {
   if(Period()>1400)
     {
      Alert("Error! Period can not be greater than D1");
      return(0);
     }
//----
   int counted_bars=IndicatorCounted();
   int barsday;
   bool rangeday;
   datetime Time1=Time[0],Time2;
//----
   if(counted_bars>0) counted_bars--;
   int limit=Bars-counted_bars;
//----
   for(int i=0; i<limit; i++)
     {
      //----
      rangeday= false;
      barsday = 0;
      //----
      Time2=Time[i]+(1440*60*DaysForCalculation);
      if(Time1<Time2)
         if(i<Bars-MathRound(1500/Period()))
            for(int a=i; a<i+1441; a++)
              {
               //----
               barsday++;
               //----
               if(TimeDayOfYear(Time[a])!=TimeDayOfYear(Time[a+1])) a=i+1442;
              }
      //----
      BufferHigh1[i]= iBands(NULL,0,barsday,Deviation,Bands_shift,Applied_price,1,i);
      BufferLow1[i] = iBands(NULL,0,barsday,Deviation,Bands_shift,Applied_price,2,i);
      BufferHigh2[i]= iBands(NULL,0,barsday,Deviation,Bands_shift,Applied_price,0,i);
     }
//----
   return(0);
  }
//+------------------------------------------------------------------+
Comments