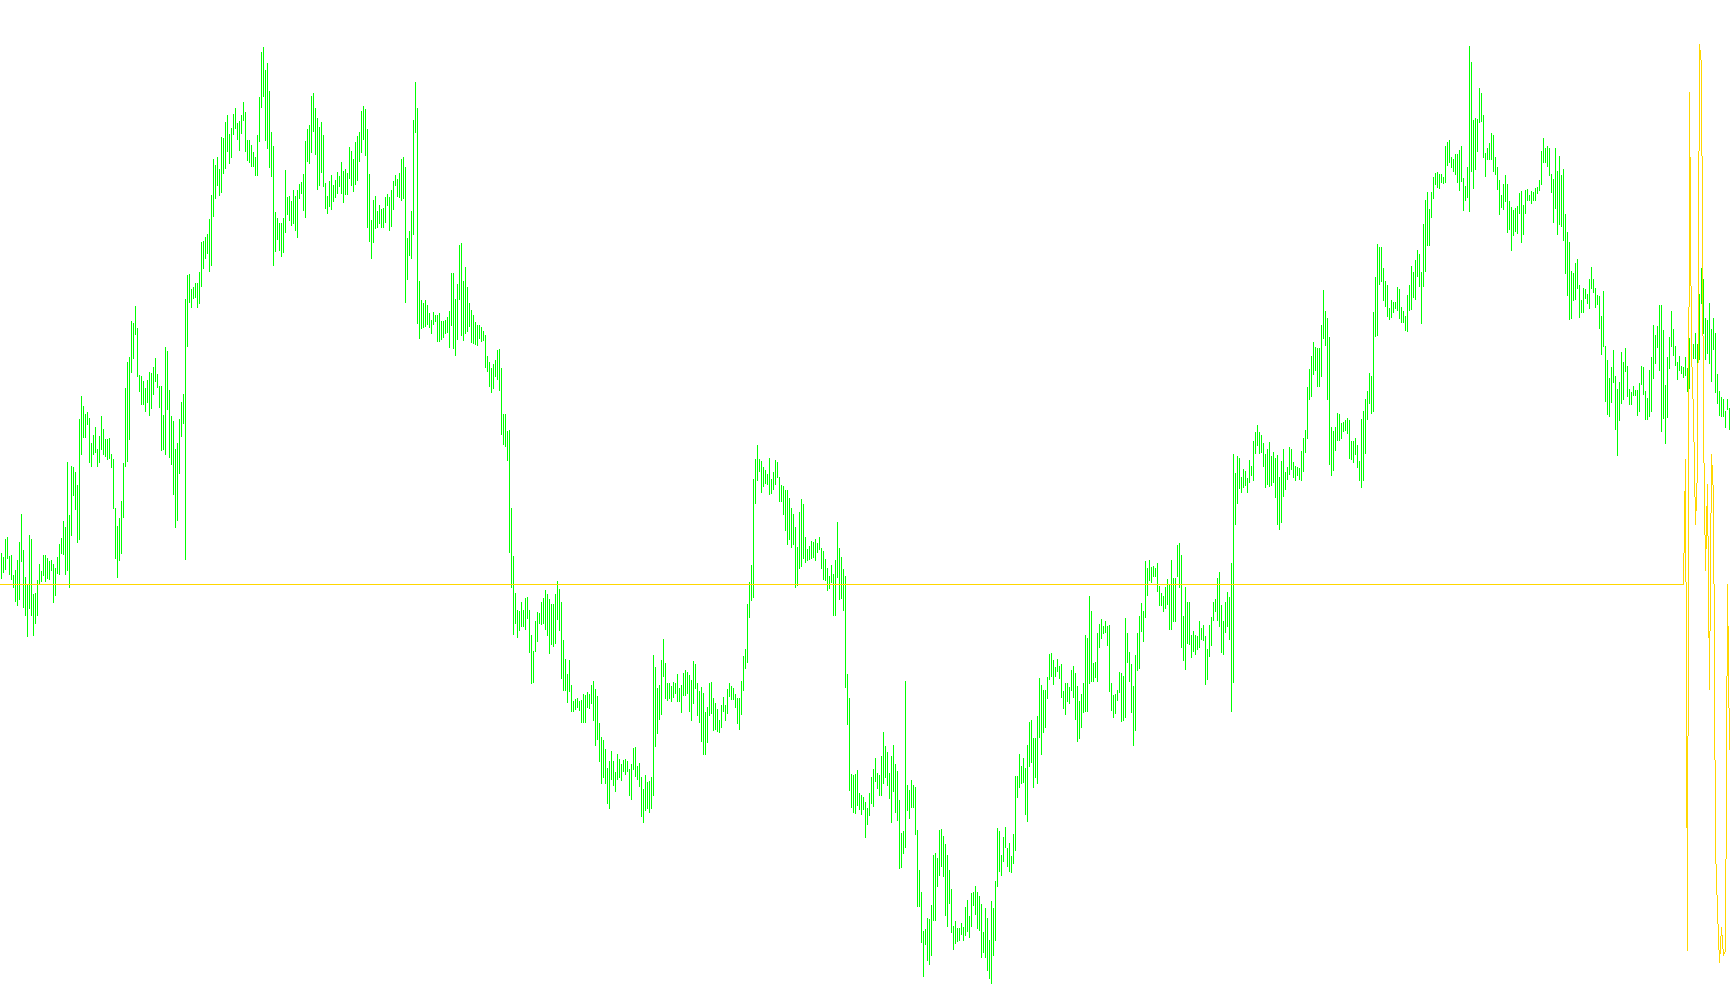
This tool is designed to help traders analyze market momentum by calculating a specific technical indicator known as the Commodity Channel Index (CCI), but with a specialized focus on daily timeframes.
Core Functionality
The primary goal of this script is to provide a smoothed perspective on price action by adjusting how the CCI is calculated over time. Instead of looking at a fixed number of candles (like the standard 14 or 20 periods used by many traders), this script dynamically calculates the number of bars needed to represent a specific number of days.
How the Logic Works
- Time-Based Scaling: The script looks at your current chart settings and determines how many price bars make up the "Days for Calculation" period specified in the settings. This ensures that whether you are looking at a 5-minute chart or a 1-hour chart, the indicator remains consistent in its view of daily movement.
- Dynamic Bar Counting: The logic automatically scans through previous price data to count exactly how many candles occur within the desired timeframe. It identifies the boundaries of days to ensure the calculation doesn't "bleed" into different calendar dates incorrectly.
- Price Application: You can choose which specific price data the indicator should track (such as the closing price, opening price, or other variants), allowing for a customized view of market volatility and overbought/oversold conditions.
- Safety Constraints: To maintain accuracy, the script includes a built-in check to ensure it is only used on timeframes smaller than a Daily chart (D1). If a timeframe larger than one day is selected, the tool will alert the user, as the daily calculation logic would no longer be valid.
Summary for the User
Essentially, this script "normalizes" the CCI indicator. It removes the guesswork of deciding how many bars to use on different timeframes by automatically calculating the correct amount of data based on actual days passed. This helps in identifying momentum trends more reliably across various trading sessions.
//+------------------------------------------------------------------+
//|                                                       DayCCI.mq4 |
//|                                 Copyright 2010-2015, Excstrategy |
//|                                        http://www.ExcStrategy.ru |
//+------------------------------------------------------------------+
#property copyright "ExcStrategy"
#property link      "http://www.ExcStrategy.ru"
#property version   "1.1"
#property description "CCI"
#property strict
//+------------------------------------------------------------------+
#property indicator_separate_window
#property indicator_buffers 1
#property indicator_color1 Blue
#property indicator_width1 1
//----
extern int Applied_price=0;
//----
extern int DaysForCalculation=2;
//---- buffers
double Buffer1[];
//+------------------------------------------------------------------+
//|                                                                  |
//+------------------------------------------------------------------+
int init()
  {
   IndicatorBuffers(1);
//---- indicator lines
   SetIndexStyle(0,DRAW_LINE);
   SetIndexBuffer(0,Buffer1);
//----
   SetIndexLabel(0,"CCI");
//---
   DaysForCalculation=DaysForCalculation+1;
//----
   return(0);
  }
//+------------------------------------------------------------------+
//|                                                                  |
//+------------------------------------------------------------------+
int start()
  {
   if(Period()>1400)
     {
      Alert("Error! Period can not be greater than D1");
      return(0);
     }
//----
   int counted_bars=IndicatorCounted();
   int barsday;
   bool rangeday;
   datetime Time1=Time[0],Time2;
//----
   if(counted_bars>0) counted_bars--;
   int limit=Bars-counted_bars;
//----
   for(int i=0; i<limit; i++)
     {
      //----
      rangeday= false;
      barsday = 0;
      //----
      Time2=Time[i]+(1440*60*DaysForCalculation);
      if(Time1<Time2)
         if(i<Bars-MathRound(1500/Period()))
            for(int a=i; a<i+1441; a++)
              {
               //----
               barsday++;
               //----
               if(TimeDayOfYear(Time[a])!=TimeDayOfYear(Time[a+1])) a=i+1442;
              }
      //----
      Buffer1[i]=iCCI(NULL,0,barsday,Applied_price,i);
     }
//----
   return(0);
  }
//+------------------------------------------------------------------+
Comments