i_DCG_Camarilla_v2
Download script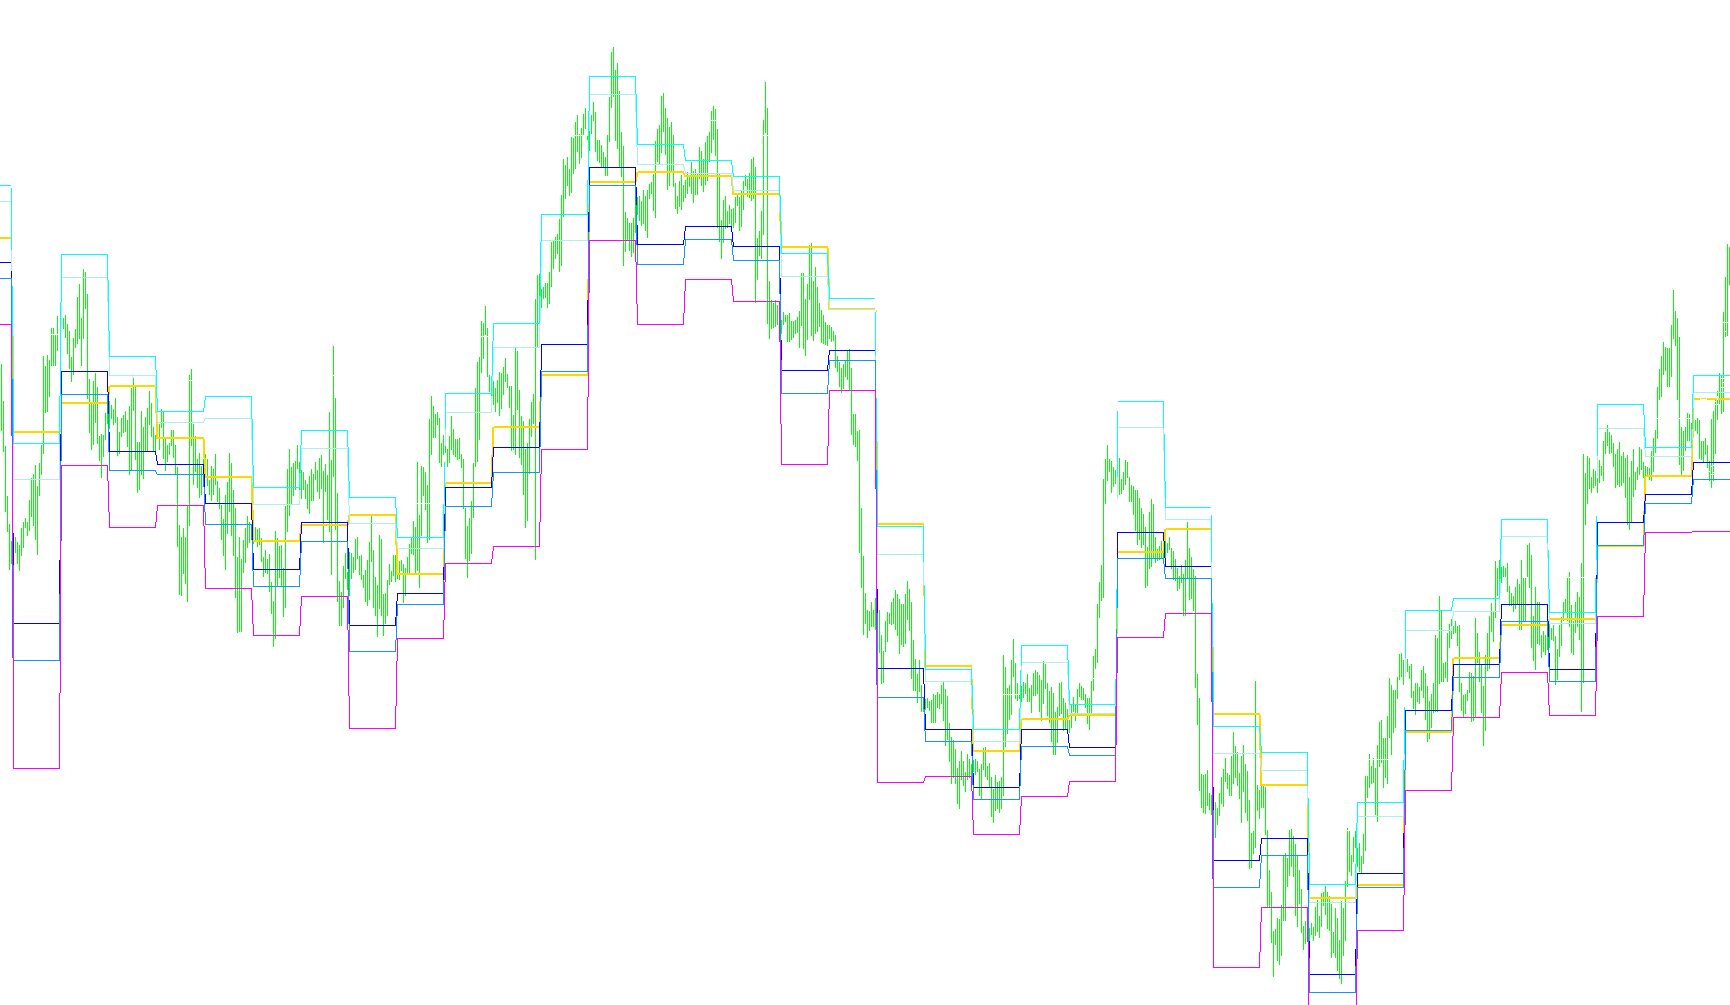
This script is designed as a technical analysis tool for the MetaTrader platform, specifically created to automatically plot Camarilla Pivot Points on a trading chart. These levels are widely used by traders to identify potential support and resistance zones within a specific trading session (usually a day).
Core Logic Overview
The primary goal of this script is to calculate and draw seven distinct price levels based on the price action of previous historical data. Instead of requiring the user to calculate these figures manually, the script scans the price history, identifies the highest and lowest points reached during a specific period, and applies a mathematical formula to project future price targets.
How the Calculation Works
The script operates by monitoring the "High" and "Low" prices of previous candles. When it detects that a new day has started (based on the timestamp of the market data), it executes the following logic:
- Range Identification: It identifies the maximum price reached (Last High) and the minimum price reached (Last Low) during the preceding period.
- Pivot Point Calculation: It determines a central "Pivot" point by averaging the previous high, low, and closing prices. This serves as the baseline for the day's trading range.
- Support and Resistance Projection: Using specific fixed multipliers (D2, D3, and D4), the script calculates four pairs of levels:
- H2/L2 & H3/L3: These represent intermediate support and resistance levels. They are often used to identify areas where price might consolidate or trend.
- H4/L4: These are the "extremes" of the Camarilla range. In professional trading, these levels are frequently watched for breakout opportunities or sharp reversals, as they represent the upper and lower boundaries of the expected daily volatility.
Visual Presentation
To make this data actionable for a user, the script performs three main visual tasks:
- Dynamic Drawing: It automatically draws horizontal lines across the chart representing all seven calculated levels.
- Labeling: It places clear text labels (such as H2, L2, etc.) on the chart so that traders can instantly distinguish between different support and resistance zones without confusion.
- Real-Time Updates: The script is designed to recalculate these levels automatically as new price data arrives, ensuring that the levels remain current as the market moves forward.
User Experience
For a non-technical user, this means the tool transforms raw historical data into a visual "map." By looking at the chart, a trader can see exactly where the market is likely to face pressure (resistance) or find a floor (support) based on the Camarilla methodology, allowing for more informed decision-making regarding entry and exit points.
// +------------------------------------------------------------------+
// |  i_DCG_Camarilla.mq4                                             |
// |  Copyright © 2005, Fermin Da Costa Gomez                         |
// | Version : 01 (Inital code)                                       |
// |                                                                  |
// +------------------------------------------------------------------+
#property copyright "Copyright © 2005, Fermin Da Costa Gomez"
#property link      "http://forex.viahetweb.nl"
//----
#property indicator_chart_window
#property indicator_buffers 7
#property indicator_color1 Aqua
#property indicator_color2 Yellow
#property indicator_color3 Yellow
#property indicator_color4 OrangeRed
#property indicator_color5 OrangeRed
#property indicator_color6 LawnGreen
#property indicator_color7 LawnGreen
//---- input parameters
//---- buffers
double PBuffer[];
double H4Buffer[];
double H3Buffer[];
double H2Buffer[];
double L2Buffer[];
double L3Buffer[];
double L4Buffer[];
string Pivot="Pivot",sL2="L2", sH2="H2";
string sL3="L3", sH3="H3", sL4="L4", sH4="H4";
int fontsize=10;
double P, L2, L3, L4, H2, H3, H4;
double LastHigh,LastLow,x;
double D1=0.091667;
double D2=0.183333;
double D3=0.2750;
double D4=0.55;
//+------------------------------------------------------------------+
//| Custor indicator deinitialization function                       |
//+------------------------------------------------------------------+
int deinit()
  {
//---- TODO: add your code here
   ObjectDelete("Pivot");
   ObjectDelete("L2");
   ObjectDelete("H2");
   ObjectDelete("L3");
   ObjectDelete("H3");
   ObjectDelete("L4");
   ObjectDelete("H4");
//----
   return(0);
  }
//+------------------------------------------------------------------+
//| Custom indicator initialization function                         |
//+------------------------------------------------------------------+
int init()
  {
   string short_name;
//---- indicator line
   SetIndexStyle(0,DRAW_LINE, 0, 2);
   SetIndexStyle(1,DRAW_LINE);
   SetIndexStyle(2,DRAW_LINE);
   SetIndexStyle(3,DRAW_LINE);
   SetIndexStyle(4,DRAW_LINE);
   SetIndexStyle(5,DRAW_LINE);
   SetIndexStyle(6,DRAW_LINE);
   SetIndexBuffer(0, PBuffer);
   SetIndexBuffer(1, L2Buffer);
   SetIndexBuffer(2, H2Buffer);
   SetIndexBuffer(3, L3Buffer);
   SetIndexBuffer(4, H3Buffer);
   SetIndexBuffer(5, L4Buffer);
   SetIndexBuffer(6, H4Buffer);
//---- name for DataWindow and indicator subwindow label
   short_name="Camarilla levels";
   IndicatorShortName(short_name);
   SetIndexLabel(0, short_name);
//----
   SetIndexDrawBegin(0,1);
//----
//----
   return(0);
  }
//+------------------------------------------------------------------+
//| Custom indicator iteration function                              |
//+------------------------------------------------------------------+
int start()
  {
   int    counted_bars=IndicatorCounted();
   int limit, i;
//---- indicator calculation
   if (counted_bars==0)
     {
      x=Period();
      if (x>240) return(-1);
      ObjectCreate("L2", OBJ_TEXT, 0, 0, 0);
      ObjectSetText("L2", "        L-2",fontsize,"Arial", White);
      ObjectCreate("H2", OBJ_TEXT, 0, 0, 0);
      ObjectSetText("H2", "        H-2",fontsize,"Arial", White);
      ObjectCreate("L3", OBJ_TEXT, 0, 0, 0);
      ObjectSetText("L3", "            L-3",fontsize,"Arial", White);
      ObjectCreate("H3", OBJ_TEXT, 0, 0, 0);
      ObjectSetText("H3", "            H-3",fontsize,"Arial", White);
      ObjectCreate("L4", OBJ_TEXT, 0, 0, 0);
      ObjectSetText("L4", "                L-4",fontsize,"Arial", White);
      ObjectCreate("H4", OBJ_TEXT, 0, 0, 0);
      ObjectSetText("H4", "                H-4",fontsize,"Arial", White);
     }
   if(counted_bars<0) return(-1);
//---- last counted bar will be recounted
//   if(counted_bars>0) counted_bars--;
   limit=(Bars-counted_bars)-1;
//----
   for(i=limit; i>=0;i--)
     {
      if (High[i+1]>LastHigh) LastHigh=High[i+1];
      if (Low[i+1]<LastLow) LastLow=Low[i+1];
      if (TimeDay(Time[i])!=TimeDay(Time[i+1]))
        {
         P=(LastHigh+LastLow+Close[i+1])/3;
         H2=(LastHigh - LastLow)*D2 +Close[i+1];
         L2=Close[i+1] - (LastHigh - LastLow)*D2;
         H3=(LastHigh - LastLow)*D3 +Close[i+1];
         L3=Close[i+1] - (LastHigh - LastLow)*D3;
         H4=(LastHigh-LastLow)*D4 + Close[i+1];
         L4=Close[i+1] - (LastHigh-LastLow)*D4;
//----
         LastLow=Open[i];
         LastHigh=Open[i];
//----
         ObjectMove("Pivot", 0, Time[i],P);
         ObjectMove("L2", 0, Time[i], L2);
         ObjectMove("H2", 0, Time[i], H2);
         ObjectMove("L3", 0, Time[i], L3);
         ObjectMove("H3", 0, Time[i], H3);
         ObjectMove("L4", 0, Time[i], L4);
         ObjectMove("H4", 0, Time[i], H4);
        }
      PBuffer[i]=P;
      L2Buffer[i]=L2;
      L3Buffer[i]=L3;
      L4Buffer[i]=L4;
      H2Buffer[i]=H2;
      H3Buffer[i]=H3;
      H4Buffer[i]=H4;
     }
//----
   return(0);
  }
//+------------------------------------------------------------------+
Comments