i-DRProjections_v[1][1].0.1
Download script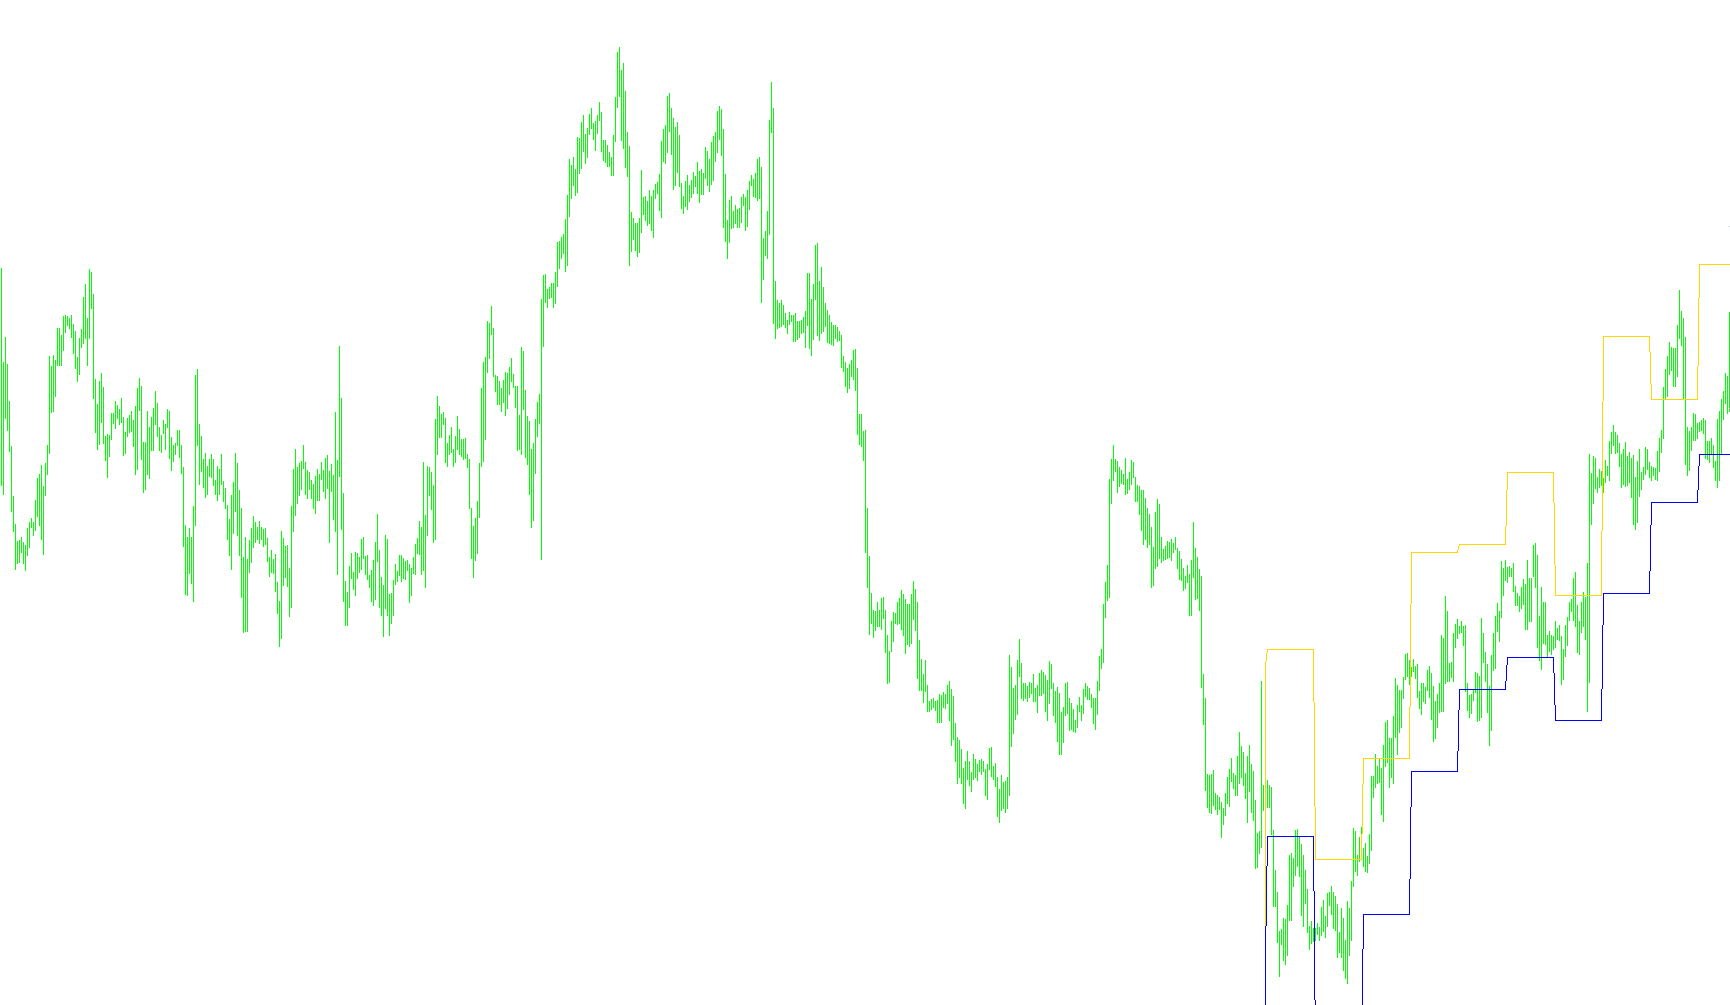
The i-DRProjections indicator is designed to help traders visualize potential price boundaries based on historical daily trading behaviors. By analyzing past price movements, the tool attempts to project where the high and low limits for the current market session might reside.
Core Logic and Functionality
Historical Data Analysis The script looks back at a specific number of previous days (customizable by the user) to identify recurring patterns. It focuses on the daily range—the distance between the highest and lowest prices reached during a single trading day.
Dynamic Price Calculation Rather than using a simple average, the tool employs a weighted calculation to determine a "pivot" or expected midpoint based on how the price closed relative to where it opened:
- If the market closed lower than it opened, the logic weights the low prices more heavily in its calculation.
- If the market closed higher than it opened, it weights the high prices more heavily.
- In cases where there was no movement between the open and close, it balances the highs and lows equally.
Visual Projections Based on these calculations, the indicator plots two distinct lines on your chart:
- The Upper Projection: Represents a calculated ceiling for the price.
- The Lower Projection: Represents a calculated floor for the price.
Future Forecasting One of the key features is the "Tomorrow" projection. The script takes the live data from the current ongoing day (the high, low, open, and the most recent bid price) and applies the same weighted logic used for historical days. It then extends these results into the future as dotted lines. This provides a visual estimate of where the price boundaries might sit in the next trading period, helping traders identify potential areas of resistance or support before they occur.
Summary for Traders
This tool serves as a visual guide for "Daily Range Projections." By identifying how the market typically reacts to its opening and closing points over time, it provides a mathematical estimate of the boundaries you might see in the upcoming session. It is intended to supplement your strategy by highlighting expected zones where price movement may slow down or reverse.
//+------------------------------------------------------------------+
//|                                              i-DRProjections.mq4 |
//|                                           Êèì Èãîðü Â. aka KimIV |
//|                                              http://www.kimiv.ru |
//|   27.08.2005 v.0.0 ïî ïðîñüáå $anto$'à                           |
//| Èíäèêàòîð Daily Range Projections                                |
//| Ïðîãíîçèðîâàíèå äíåâíûõ äèàïàçîíîâ öåí                           |
//| Àâòîð èäåè Òîìàñ Äåìàðê                                          |
//|   29.08.2005 v.0.1 Äîðàáîòêà Aleks78                             |
//+------------------------------------------------------------------+
#property copyright "Êèì Èãîðü Â. aka KimIV"
#property link      "http://www.kimiv.ru"

#property indicator_chart_window
#property indicator_buffers 2
#property indicator_color1 LightBlue
#property indicator_color2 LightSalmon

//------- Âíåøíèå ïàðàìåòðû ------------------------------------------
extern int  NumberOfDay  = 10;   // Êîëè÷åñòâî äíåé
extern bool ShowTomorrow = True; // Ïîêàçûâàòü çàâòðà

//------- Áóôåðû èíäèêàòîðà ------------------------------------------
double MaxDay[];
double MinDay[];

//+------------------------------------------------------------------+
//| Custom indicator initialization function                         |
//+------------------------------------------------------------------+
void init() {
  if (ShowTomorrow) {
    ObjectCreate("LineHi", OBJ_TREND, 0, 0,0, 0,0);
    ObjectCreate("LineLo", OBJ_TREND, 0, 0,0, 0,0);
  }

  SetIndexBuffer(0, MaxDay);
  SetIndexStyle (0, DRAW_LINE, STYLE_SOLID, 1);
  SetIndexBuffer(1, MinDay);
  SetIndexStyle (1, DRAW_LINE, STYLE_SOLID, 1);
  Comment("");
}

//+------------------------------------------------------------------+
//| Custor indicator deinitialization function                       |
//+------------------------------------------------------------------+
void deinit() {
  ObjectDelete("LineHi");
  ObjectDelete("LineLo");
  Comment("");
}

//+------------------------------------------------------------------+
//| Custom indicator iteration function                              |
//+------------------------------------------------------------------+
int start() {
  double po, ph, pl, pc, x;
  double MaxDay1, MinDay1, OpenDay1, CloseDay1; //+++
  int    currDay, i=0, j=0;

  if (Period()>240) {
    Comment("Èíäèêàòîð i-DRProjections íå ïîääåðæèâàåò ÒÔ áîëåå Í4 !");
    return;
  }

  while (i<=NumberOfDay) {
    if (currDay!=TimeDay(Time[j])) {
      po = iOpen (NULL, 1440, i+1);
      ph = iHigh (NULL, 1440, i+1);
      pl = iLow  (NULL, 1440, i+1);
      pc = iClose(NULL, 1440, i+1);
      if (pc<po) x = (ph + pl + pc + pl) / 2;
      if (pc>po) x = (ph + pl + pc + ph) / 2;
      if (pc==po) x = (ph + pl + pc + pc) / 2;
      i++;
    }
    currDay = TimeDay(Time[j]);
    MaxDay[j] = x - pl;
    MinDay[j] = x - ph;
    j++;
  }

  //++++++++++++++++++++++++++++++++++++++++++++++++
  if (ShowTomorrow) {
    MaxDay1   = MarketInfo(Symbol(),MODE_HIGH);
    MinDay1   = MarketInfo(Symbol(),MODE_LOW);
    OpenDay1  = iOpen (NULL, 1440, 0);
    CloseDay1 = Bid;

    if (CloseDay1<OpenDay1) x = (MaxDay1 + MinDay1 + CloseDay1 + MinDay1) / 2;
    if (CloseDay1>OpenDay1) x = (MaxDay1 + MinDay1 + CloseDay1 + MaxDay1) / 2;
    if (CloseDay1==OpenDay1) x = (MaxDay1 + MinDay1 + CloseDay1 + CloseDay1) / 2;

    ObjectSet("LineHi",OBJPROP_TIME1, Time[1]);
    ObjectSet("LineLo",OBJPROP_TIME1, Time[1]);
    ObjectSet("LineHi",OBJPROP_PRICE1, x - MinDay1);
    ObjectSet("LineLo",OBJPROP_PRICE1, x - MaxDay1);
    ObjectSet("LineHi",OBJPROP_TIME2, CurTime());
    ObjectSet("LineLo",OBJPROP_TIME2, CurTime());
    ObjectSet("LineHi",OBJPROP_PRICE2, x - MinDay1);
    ObjectSet("LineLo",OBJPROP_PRICE2, x - MaxDay1);
    ObjectSet("LineHi",OBJPROP_COLOR, indicator_color1);
    ObjectSet("LineLo",OBJPROP_COLOR, indicator_color2);
    ObjectSet("LineHi",OBJPROP_RAY, True);
    ObjectSet("LineLo",OBJPROP_RAY, True);
    ObjectSet("LineHi",OBJPROP_STYLE, STYLE_DOT);
    ObjectSet("LineLo",OBJPROP_STYLE, STYLE_DOT);
  }
  //++++++++++++++++++++++++++++++++++++++++++++++++
}
//+------------------------------------------------------------------+
Comments