#_i_FFT_separate_Close2_W_D_diff
Download script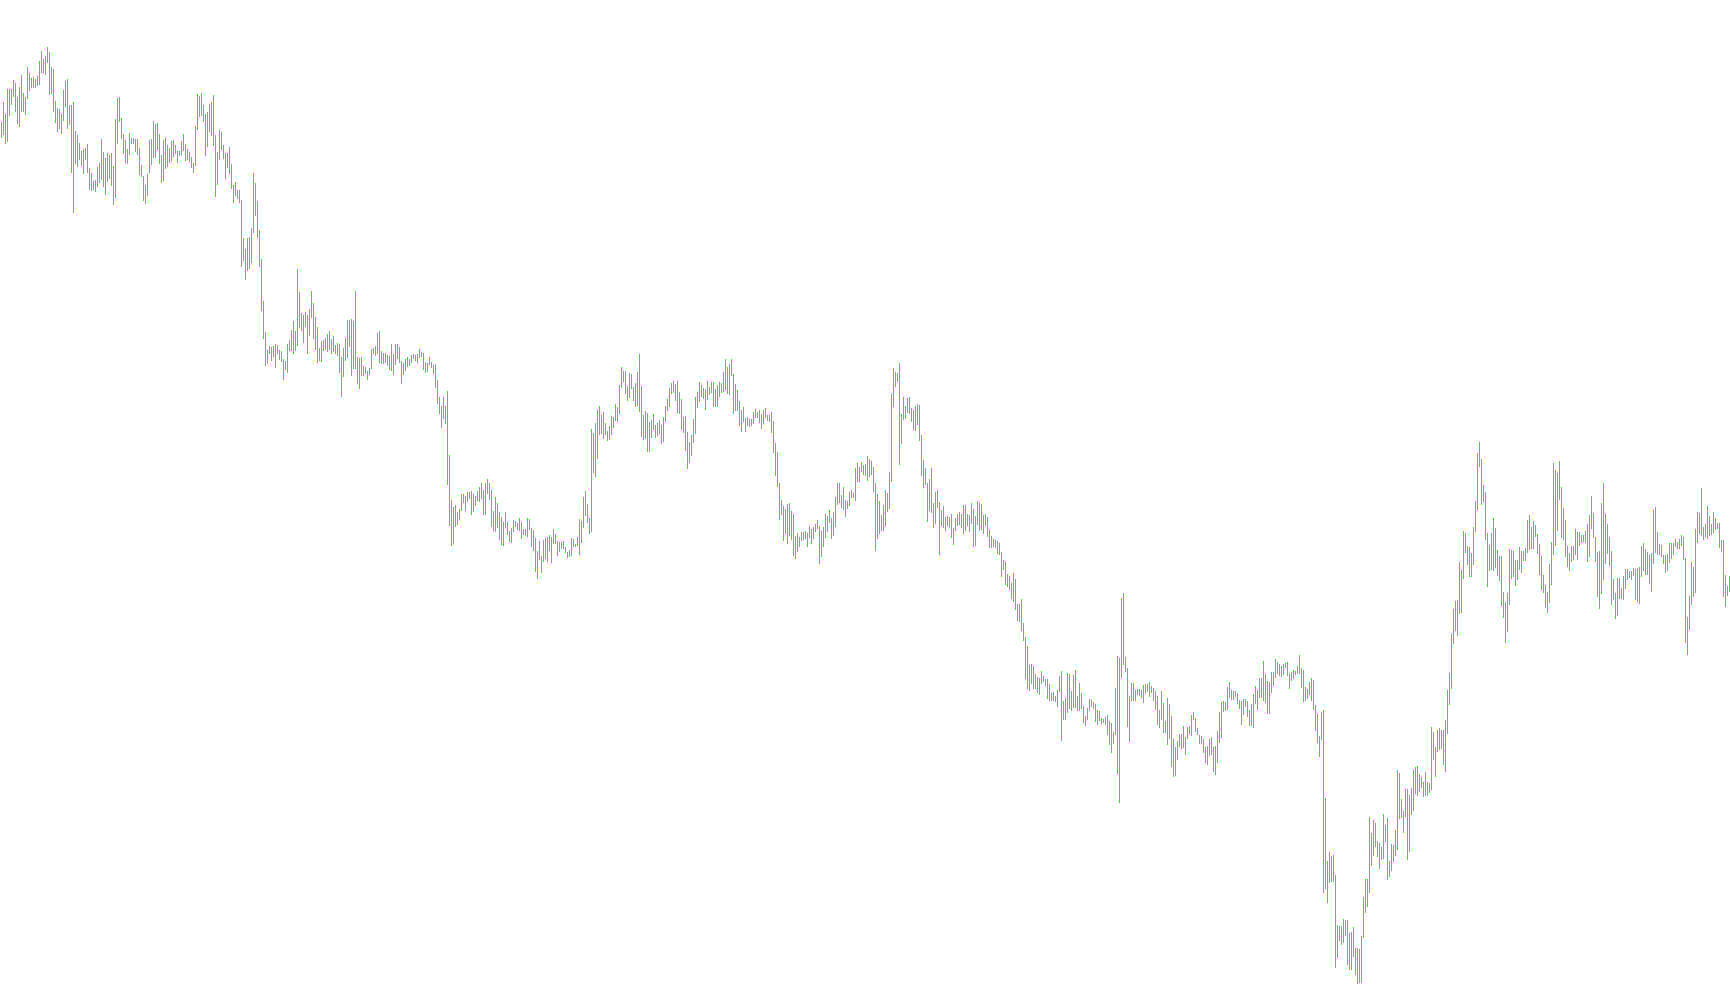
This script is a sophisticated technical analysis tool designed to identify hidden trends and momentum in financial markets by analyzing the underlying frequency of price movements. Rather than simply looking at where the price is going, it decomposes market data into its individual components to reveal patterns that are often invisible to the naked eye.
Core Logic Overview
The tool operates on a principle similar to how high-end audio equipment separates different notes in a musical chord. It takes a specific window of recent price history and subjects it to a mathematical process called a "Fast Fourier Transform." This allows the script to break down complex market volatility into distinct frequencies.
How the Analysis Works
The script performs several layered operations to generate its visual signals:
- Data Collection & Comparison: The tool looks at two different snapshots of price data simultaneously. By comparing these two windows, it can detect subtle shifts in market energy over a specific timeframe.
- Frequency Filtering: The logic includes a "filter" system. It identifies which frequencies are relevant to the current market move and ignores the "noise." This ensures that the final output focuses on significant trends rather than minor, insignificant price flickers.
- Reconstruction: After filtering out the noise, the script reconstructs the data. This process highlights the core momentum of the price action.
- Difference Calculation: The primary goal of this reconstruction is to measure the difference between the two compared data sets. This difference represents the "strength" of a specific trend movement.
Visual Representation
The results are displayed on a separate window with four distinct indicators:
- Momentum Tracking: The script provides lines and histograms that show the magnitude of the difference between the price snapshots.
- Directional Signaling: The logic automatically assigns colors based on the direction of the trend movement. When the difference shifts in one direction, it highlights specific bars (Blue), and when it shifts in the opposite direction, it highlights others (Red).
- Smoothed Trend Analysis: To prevent the user from reacting to every minor fluctuation, the script applies a Moving Average to the final calculated differences. This results in a smooth line that helps traders identify the overarching direction of the market trend with greater clarity.
Summary for the User
In essence, this tool acts as a "spectrometer" for price action. It strips away the chaotic noise of the market to show you the pure momentum of the underlying trend. By using frequency analysis, it provides a more nuanced view of price movement than standard indicators, helping you see where the real strength lies in the current market environment.
//+------------------------------------------------------------------+
//|                                            #_i_SpecktrAnalis.mq4 |
//|                                          Copyright © 2006, klot. |
//|                                                     klot@mail.ru |
//+------------------------------------------------------------------+
#property copyright "Copyright © 2006, klot."
#property link      "klot@mail.ru"


#import "#_lib_FFT.ex4"
void realfastfouriertransform(double& a[], int tnn, bool inversefft);
#import

#property indicator_separate_window
#property indicator_buffers 4
#property indicator_color1 Yellow
#property indicator_color2 Blue
#property indicator_color3 Red
#property indicator_color4 Lime
#property indicator_level1 0.0
#property indicator_level2 0.005
#property indicator_level3 -0.005
#property indicator_level4 0.01
#property indicator_level5 -0.01
//---- buffers
double Buffer1[];
double Buffer2[];
double Buffer3[];
double Buffer4[];
//---
extern int n=7; // Äëèíà ðÿäà
extern int Fmin=2;//80;//2; // Ãðíèöà Ôèëüòðà ïî Í×.
extern int Fmax=60;//128; // Ãðàíèöà Ôèëüòðà ïî Â×.
//extern string sym="GBPUSD";
extern int shift=6;//extern string sym="EURUSD";
extern int MaPeriod=10;

double aa[];
double bb[];
int N;

//+------------------------------------------------------------------+
//| Custom indicator initialization function                         |
//+------------------------------------------------------------------+
int init()
  {
//---- indicators
SetIndexStyle(0,DRAW_LINE,0,1);
SetIndexBuffer(0,Buffer1);
SetIndexEmptyValue(0,0);
SetIndexStyle(1,DRAW_HISTOGRAM,0,1);
SetIndexBuffer(1,Buffer2);
SetIndexEmptyValue(1,0);
SetIndexStyle(2,DRAW_HISTOGRAM,0,1);
SetIndexBuffer(2,Buffer3);
SetIndexEmptyValue(2,0);
SetIndexStyle(3,DRAW_LINE,2,1);
SetIndexBuffer(3,Buffer4);
SetIndexEmptyValue(3,0);

//---
   N=MathPow(2,n);
   ArrayResize(aa,N);
   ArrayResize(bb,N);

if( Fmax>=N ) Fmax=N;
if( Fmin<=2 ) Fmin=2;

//----
   return(0);
  }
//+------------------------------------------------------------------+
//| Custom indicator deinitialization function                       |
//+------------------------------------------------------------------+
int deinit()
  {
//----

//----
   return(0);
  }
//+------------------------------------------------------------------+
//| Custom indicator iteration function                              |
//+------------------------------------------------------------------+
int start()
  {

   if( Bars<N+shift) return(0);

   //---
   for(int i=N-1; i>=0; i--)
   {
     aa[i]=iClose(Symbol(),0,i);
     bb[i]=iClose(Symbol(),0,i+shift);
   }
   //---
   realfastfouriertransform(aa, N, false);
   realfastfouriertransform(bb, N, false);
   //---
   N=ArraySize(aa);
   //Comment("n= ",N);
   //---
   for( i=0; i<=N-1; i++)
   {
      if( i<Fmin || i>Fmax) { aa[i]=0.0;bb[i]=0.0; }
   }
   //---
   realfastfouriertransform(aa, N, true);
   realfastfouriertransform(bb, N, true);
   //---
   SetIndexDrawBegin(2,Bars-N);
   //SetIndexDrawBegin(1,Bars-N-shift);
   SetIndexDrawBegin(1,Bars-N);
   SetIndexDrawBegin(0,Bars-N);
   //---
   for( i=0; i<=N-1; i++)
   {
      double diff1=bb[i]-aa[i];
      if (diff1<0)
      {
        Buffer3[i]=0;//red
        Buffer2[i]=-diff1;//blue
      //Buffer2[i+shift]=bb[i];
      }
      else if (diff1>0)
      {
        Buffer3[i]=-diff1;//red
        Buffer2[i]=0; //blue
      }
      Buffer1[i]=-diff1;

   }
   for( i=0; i<=N-1; i++)
   {
     Buffer4[i]=iMAOnArray(Buffer1,0,MaPeriod,0,MODE_SMA,i);
   }
   //----
   return(0);
  }
//-------------------------------------------------------------------+
Comments