i-LRL-2Color
Download script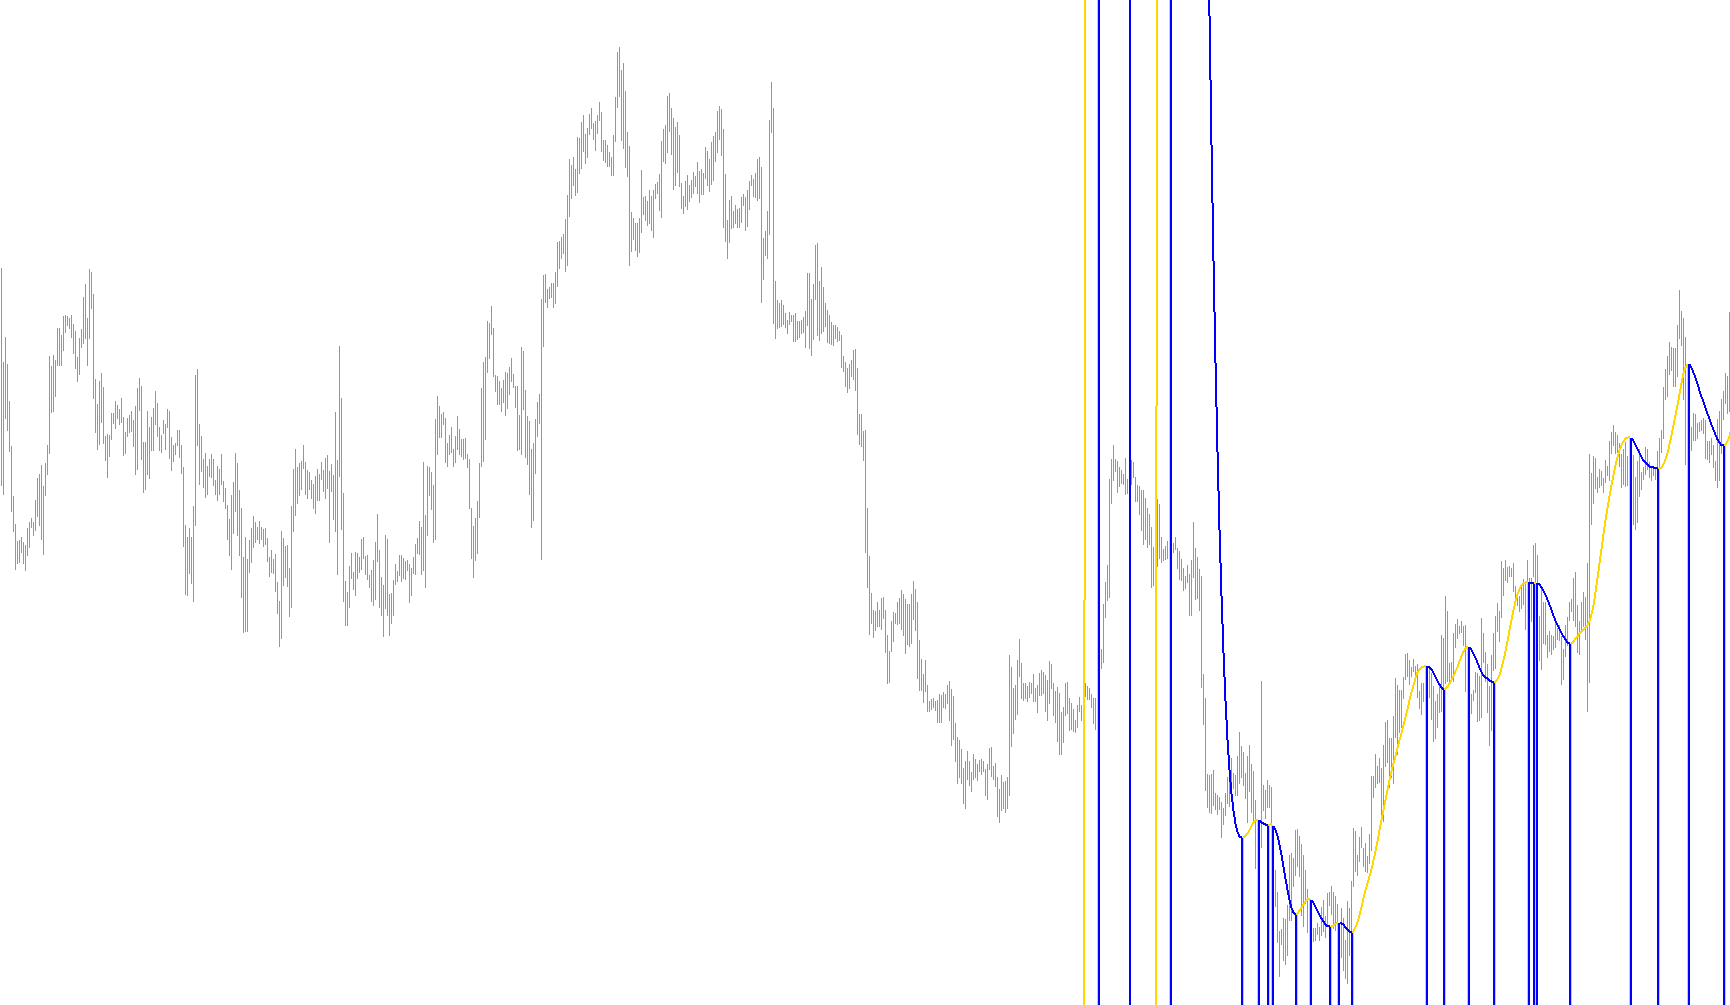
This script is a technical analysis tool designed to help traders visualize price trends and identify potential momentum shifts by using two distinct mathematical models: Linear Regression and the T3 Smoothing algorithm.
Core Functionality
The primary purpose of this indicator is to "smooth out" market noise, making it easier to see the underlying direction of the price without being distracted by minor, momentary fluctuations. It accomplishes this by calculating a moving average that reacts more intelligently to trend changes than standard indicators.
The Logic Breakdown
1. Linear Regression Foundation The script first performs a linear regression calculation over a specific period (defined by the user). Linear regression works by looking at a set of historical price points and drawing a "line of best fit" through them. This represents the general trajectory of the price during that timeframe, effectively identifying whether the prevailing trend is upward, downward, or flat.
2. The T3 Smoothing Filter To refine these findings, the script applies a sophisticated smoothing technique known as the T3. Unlike a simple moving average—which can be "laggy" and react too slowly to new information—the T3 uses a weighted calculation to balance responsiveness with smoothness. It aims to capture the current price movement accurately while filtering out "jitter" or "noise" that could lead to false signals.
3. Visual Trend Separation (Dual Lines) The most unique feature of this script is how it presents the data on your chart. Instead of just showing one line, it splits the T3 calculation into two distinct visual components:
- Upward Momentum: When the smoothed price shows a positive progression (the current value is higher than the previous one), the script plots a specific line to highlight the rising trend.
- Downward Momentum: When the smoothed price shows a negative progression (the current value is lower than the previous one), it switches to a different visual representation to highlight the falling trend.
How to Interpret the Result
By looking at the lines on the chart, a user can quickly distinguish between active buying momentum and selling pressure. Because the script effectively "hides" the data when the direction doesn't match the specific condition (setting those values to zero), it allows for a much cleaner visual experience. This helps traders see exactly where a trend has flipped from one direction to another, providing a clearer picture of market sentiment at a glance.
//+------------------------------------------------------------------+
//|                                            i-RoundPrice-T01m.mq4 |
//|          25.07.2006  Translated on MT4 by Êèì Èãîðü Â. aka KimIV |
//|                                              http://www.kimiv.ru |
//|                    modification by maloma - maloma@datasvit.net  |
//+------------------------------------------------------------------+
/*[[
	Name := RoundPrice
	Author := Copyright © 2006, HomeSoft Tartan Corp.
	Link := spiky@transkeino.ru
	Separate Window := No
	First Color := Lime
	First Draw Type := Line
	First Symbol := 217
	Use Second Data := Yes
	Second Color := Red
	Second Draw Type := Line
	Second Symbol := 218
]]*/
#property copyright "Copyright © 2006, HomeSoft Tartan Corp."
#property link      "spiky@transkeino.ru"
//----
#property indicator_chart_window
#property indicator_buffers 2
#property indicator_color1 Aqua
#property indicator_color2 Red
#property indicator_width1 2
#property indicator_width2 2
//------- Âíåøíèå ïàðàìåòðû èíäèêàòîðà -------------------------------
extern int LRLPeriod=21;
extern int t3_period=21;
extern double b=0.7;
extern int mBar=300;
//------- Ãëîáàëüíûå ïåðåìåííûå èíäèêàòîðà ---------------------------
double dBuf0[], dBuf1[];
double LRLBuffer[];
//+------------------------------------------------------------------+
//| Custom indicator initialization function                         |
//+------------------------------------------------------------------+
  void init()
  {
   SetIndexBuffer    (0, dBuf0);
   SetIndexEmptyValue(0, EMPTY_VALUE);
   SetIndexStyle     (0, DRAW_LINE,EMPTY,2);
   SetIndexBuffer    (1, dBuf1);
   SetIndexEmptyValue(1, EMPTY_VALUE);
   SetIndexStyle     (1, DRAW_LINE,EMPTY,2);
   SetIndexStyle(2,DRAW_NONE);
   SetIndexBuffer(2,LRLBuffer);
   IndicatorDigits(Digits);
   if(LRLPeriod < 2) LRLPeriod=2;
   IndicatorShortName("T3 2 Color Linear Regression Line ("+LRLPeriod+")");
   SetIndexDrawBegin(2,LRLPeriod+2);
   IndicatorDigits(MarketInfo(Symbol(),MODE_DIGITS)+4);
  }
//+------------------------------------------------------------------+
//| Custom indicator iteration function                              |
//+------------------------------------------------------------------+
  void start()
  {
   bool   ft=True;
   double e1, e2, e3, e4, e5, e6, c1, c2, c3, c4, n, w1, w2, b2, b3;
   double t3[];
   int    LoopBegin, shift, k;
   double sumx=0, sumy=0, sumxy=0, sumx2=0, sumy2=0;
   double m=0, yint=0, r=0;
//----
   int limit;
   int counted_bars=IndicatorCounted();
   if(counted_bars<0) counted_bars=0;
   if(counted_bars>0) counted_bars--;
   limit=Bars-counted_bars;
   for(shift=limit-1; shift>=0; shift--)
     {
      sumx=0;
      sumy=0;
      sumxy=0;
      sumx2=0;
      sumy2=0;
      for(k=0; k<=LRLPeriod-1; k++)
        {
         sumx=sumx + k;
         sumy=sumy + Close[shift + k];
         sumxy=sumxy + k * Close[shift + k];
         sumx2=sumx2 + k * k;
         sumy2=sumy2 + Close[shift + k] * Close[shift + k];
        }
      m=(LRLPeriod*sumxy-sumx*sumy)/(LRLPeriod*sumx2-sumx*sumx);
      yint=(sumy+m*sumx)/LRLPeriod;
      r=(LRLPeriod*sumxy-sumx*sumy)/MathSqrt((LRLPeriod*sumx2-sumx*sumx)*(LRLPeriod*sumy2-sumy*sumy));
      LRLBuffer[shift]=yint-m*LRLPeriod;
     }
   if (mBar==0) LoopBegin=Bars-t3_period-1;
   else LoopBegin=mBar;
   LoopBegin=MathMin(LoopBegin, Bars-t3_period-1);
//----
   ArrayResize(t3, LoopBegin);
     if (ft)
     {
      b2=b*b;
      b3=b2*b;
      c1=-b3;
      c2=(3*(b2+b3));
      c3=-3*(2*b2+b+b3);
      c4=(1+3*b+b3+3*b2);
      n=t3_period;
//----
      if (n<1) n=1;
      n=1+0.5*(n-1);
      w1=2/(n+1);
      w2=1-w1;
      ft=False;
     }
     for(shift=LoopBegin; shift>=0; shift--)
     {
      e1=w1*Close[shift]+w2*e1;
      e2=w1*e1+w2*e2;
      e3=w1*e2+w2*e3;
      e4=w1*e3+w2*e4;
      e5=w1*e4+w2*e5;
      e6=w1*e5+w2*e6;
//----
      t3[shift]=c1*e6+c2*e5+c3*e4+c4*e3;
      if (t3[shift+1]<=t3[shift]) dBuf0[shift]=t3[shift]; else dBuf0[shift]=0;
      if (t3[shift+1]>t3[shift]) dBuf1[shift]=t3[shift]; else dBuf1[shift]=0;
     }
  }
//+------------------------------------------------------------------+
Comments