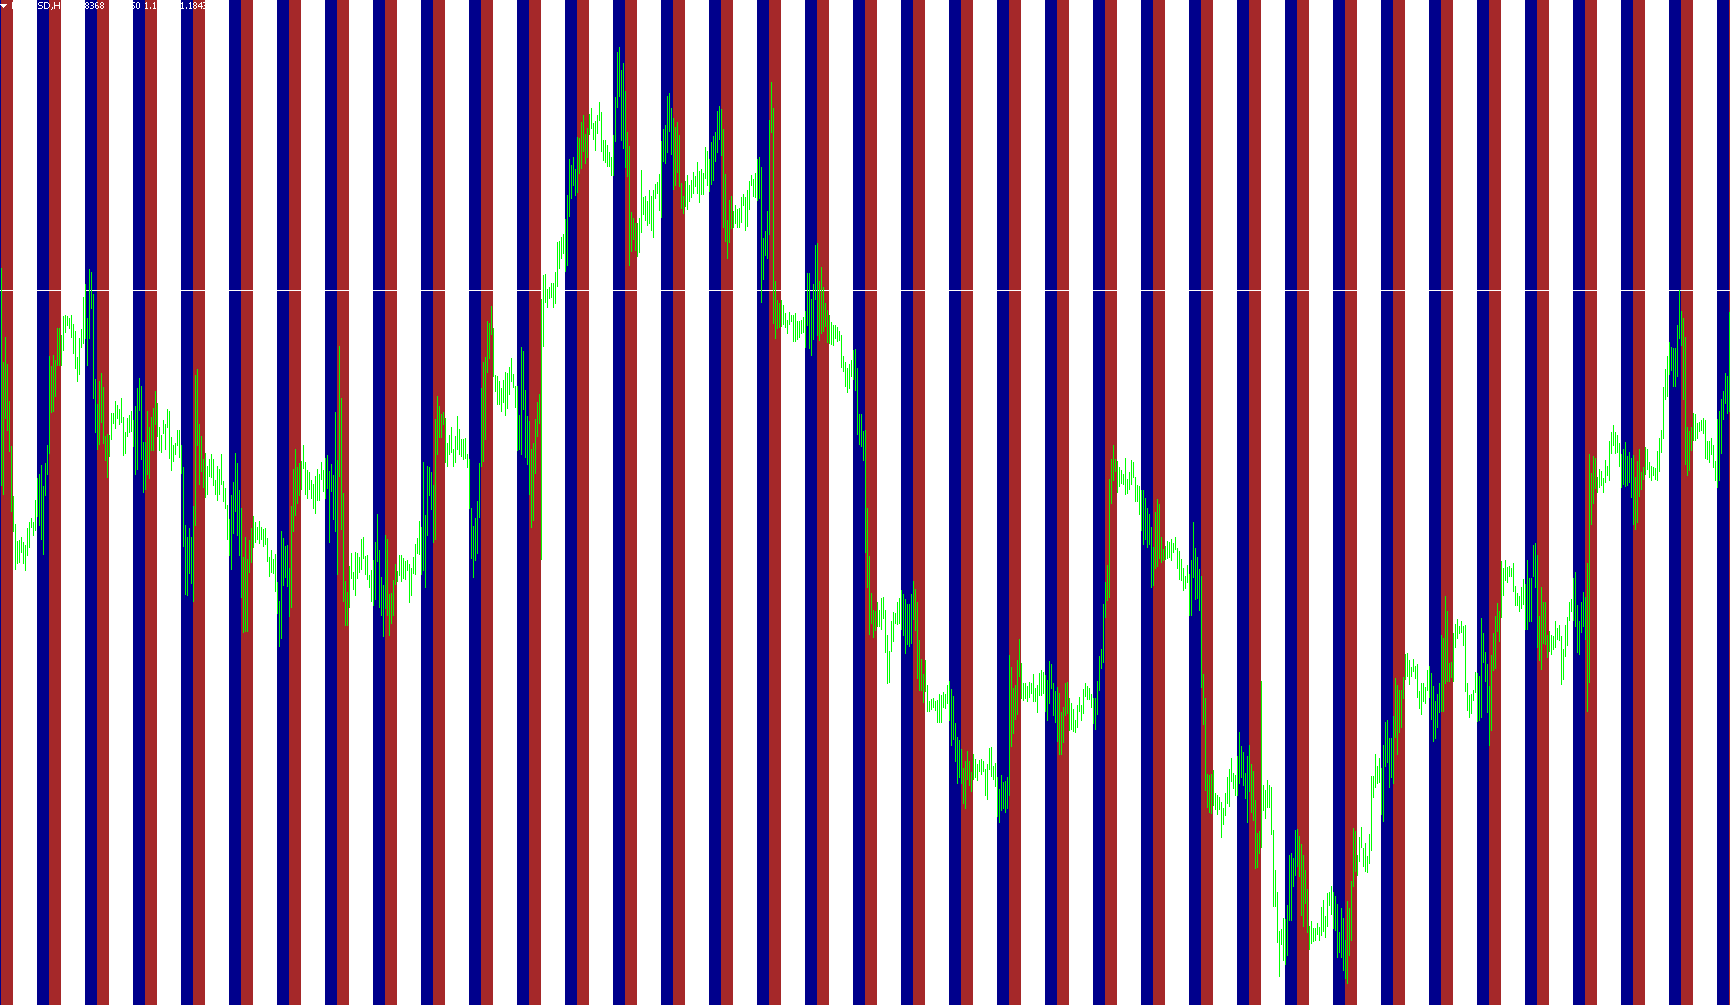
This script is designed for the MetaTrader trading platform to provide a visual representation of specific trading sessions directly on your price chart. Instead of manually calculating when certain markets open or close, this tool automatically highlights relevant time blocks over the past several days, helping traders quickly identify periods of high activity or specific "work times."
How it Works
1. Customizable Time Windows The logic allows you to define two distinct time blocks per day. You can set the start and end times for each session (for example, a morning session and an afternoon session). Each session can be assigned its own unique color, making it easy to distinguish between different market behaviors or sessions at a glance.
2. Historical Visualization Rather than just showing today's time, the script looks back across a user-defined number of previous days (set by the "Number of Days" parameter). It automatically populates the chart with shaded rectangles that correspond to the start and end times you have chosen for each of those historical days.
3. Dynamic Price Mapping The tool doesn't just draw lines; it creates visual "zones" on your chart. It calculates the high and low price points reached during those specific timeframes. Based on your settings, it can either:
- Draw a box based on the actual highest and lowest prices reached during that period.
- Use a default calculation to create a consistent visual area for that timeframe.
4. Smart Date Handling To ensure accuracy, the script includes built-in logic to handle the calendar correctly. It is designed to skip over weekends and automatically adjust for different month lengths and leap years. This ensures that the shaded zones appear on the correct dates across the timeline without manual intervention.
Key Benefits for Traders
- Visual Clarity: By shading the background of specific hours, you can immediately see which parts of the day are your primary focus areas.
- Session Analysis: It allows you to visually compare price action during specific "work times" over a long historical period to identify patterns or volatility.
- Automation: You no longer need to manually draw boxes or markers on your chart every time you want to review past trading sessions; the script builds the history for you automatically upon loading.
//+------------------------------------------------------------------+
//|                                            i-ParamonWorkTime.mq4 |
//|                                           Êèì Èãîðü Â. aka KimIV |
//|                                              http://www.kimiv.ru |
//|                                                                  |
//|  23.11.2005  Èíäèêàòîð ðàáî÷åãî âðåìåíè Ïàðàìîíà.                |
//+------------------------------------------------------------------+
#property copyright "Êèì Èãîðü Â. aka KimIV"
#property link      "http://www.kimiv.ru"

#property indicator_chart_window

//------- Âíåøíèå ïàðàìåòðû èíäèêàòîðà -------------------------------
extern int    NumberOfDays = 50;        // Êîëè÷åñòâî äíåé
extern string Begin_1      = "09:30";
extern string End_1        = "15:00";
extern color  Color_1      = DarkBlue;
extern string Begin_2      = "15:00";
extern string End_2        = "21:30";
extern color  Color_2      = Brown;
extern bool   HighRange    = False;


//+------------------------------------------------------------------+
//| Custom indicator initialization function                         |
//+------------------------------------------------------------------+
void init() {
  DeleteObjects();
  for (int i=0; i<NumberOfDays; i++) {
    CreateObjects("PWT1"+i, Color_1);
    CreateObjects("PWT2"+i, Color_2);
  }
  Comment("");
}

//+------------------------------------------------------------------+
//| Custor indicator deinitialization function                       |
//+------------------------------------------------------------------+
void deinit() {
  DeleteObjects();
  Comment("");
}

//+------------------------------------------------------------------+
//| Ñîçäàíèå îáúåêòîâ èíäèêàòîðà                                     |
//| Ïàðàìåòðû:                                                       |
//|   no - íàèìåíîâàíèå îáúåêòà                                      |
//|   cl - öâåò îáúåêòà                                              |
//+------------------------------------------------------------------+
void CreateObjects(string no, color cl) {
  ObjectCreate(no, OBJ_RECTANGLE, 0, 0,0, 0,0);
  ObjectSet(no, OBJPROP_STYLE, STYLE_SOLID);
  ObjectSet(no, OBJPROP_COLOR, cl);
  ObjectSet(no, OBJPROP_BACK, True);
}

//+------------------------------------------------------------------+
//| Óäàëåíèå îáúåêòîâ èíäèêàòîðà                                     |
//+------------------------------------------------------------------+
void DeleteObjects() {
  for (int i=0; i<NumberOfDays; i++) {
    ObjectDelete("PWT1"+i);
    ObjectDelete("PWT2"+i);
  }
}

//+------------------------------------------------------------------+
//| Custom indicator iteration function                              |
//+------------------------------------------------------------------+
void start() {
  datetime dt=CurTime();

  for (int i=0; i<NumberOfDays; i++) {
    DrawObjects(dt, "PWT1"+i, Begin_1, End_1);
    DrawObjects(dt, "PWT2"+i, Begin_2, End_2);
    dt=decDateTradeDay(dt);
    while (TimeDayOfWeek(dt)>5) dt=decDateTradeDay(dt);
  }
}

//+------------------------------------------------------------------+
//| Ïðîðèñîâêà îáúåêòîâ íà ãðàôèêå                                   |
//| Ïàðàìåòðû:                                                       |
//|   dt - äàòà òîðãîâîãî äíÿ                                        |
//|   no - íàèìåíîâàíèå îáúåêòà                                      |
//|   tb - âðåìÿ íà÷àëà ñåññèè                                       |
//|   te - âðåìÿ îêîí÷àíèÿ ñåññèè                                    |
//+------------------------------------------------------------------+
void DrawObjects(datetime dt, string no, string tb, string te) {
  datetime t1, t2;
  double   p1, p2;
  int      b1, b2;

  t1=StrToTime(TimeToStr(dt, TIME_DATE)+" "+tb);
  t2=StrToTime(TimeToStr(dt, TIME_DATE)+" "+te);
  b1=iBarShift(NULL, 0, t1);
  b2=iBarShift(NULL, 0, t2);
  p1=High[Highest(NULL, 0, MODE_HIGH, b1-b2, b2)];
  p2=Low [Lowest (NULL, 0, MODE_LOW , b1-b2, b2)];
  if (!HighRange) {p1=0; p2=2*p2;}
  ObjectSet(no, OBJPROP_TIME1 , t1);
  ObjectSet(no, OBJPROP_PRICE1, p1);
  ObjectSet(no, OBJPROP_TIME2 , t2);
  ObjectSet(no, OBJPROP_PRICE2, p2);
}

//+------------------------------------------------------------------+
//| Óìåíüøåíèå äàòû íà îäèí òîðãîâûé äåíü                            |
//| Ïàðàìåòðû:                                                       |
//|   dt - äàòà òîðãîâîãî äíÿ                                        |
//+------------------------------------------------------------------+
datetime decDateTradeDay (datetime dt) {
  int ty=TimeYear(dt);
  int tm=TimeMonth(dt);
  int td=TimeDay(dt);
  int th=TimeHour(dt);
  int ti=TimeMinute(dt);

  td--;
  if (td==0) {
    tm--;
    if (tm==0) {
      ty--;
      tm=12;
    }
    if (tm==1 || tm==3 || tm==5 || tm==7 || tm==8 || tm==10 || tm==12) td=31;
    if (tm==2) if (MathMod(ty, 4)==0) td=29; else td=28;
    if (tm==4 || tm==6 || tm==9 || tm==11) td=30;
  }
  return(StrToTime(ty+"."+tm+"."+td+" "+th+":"+ti));
}
//+------------------------------------------------------------------+
Comments