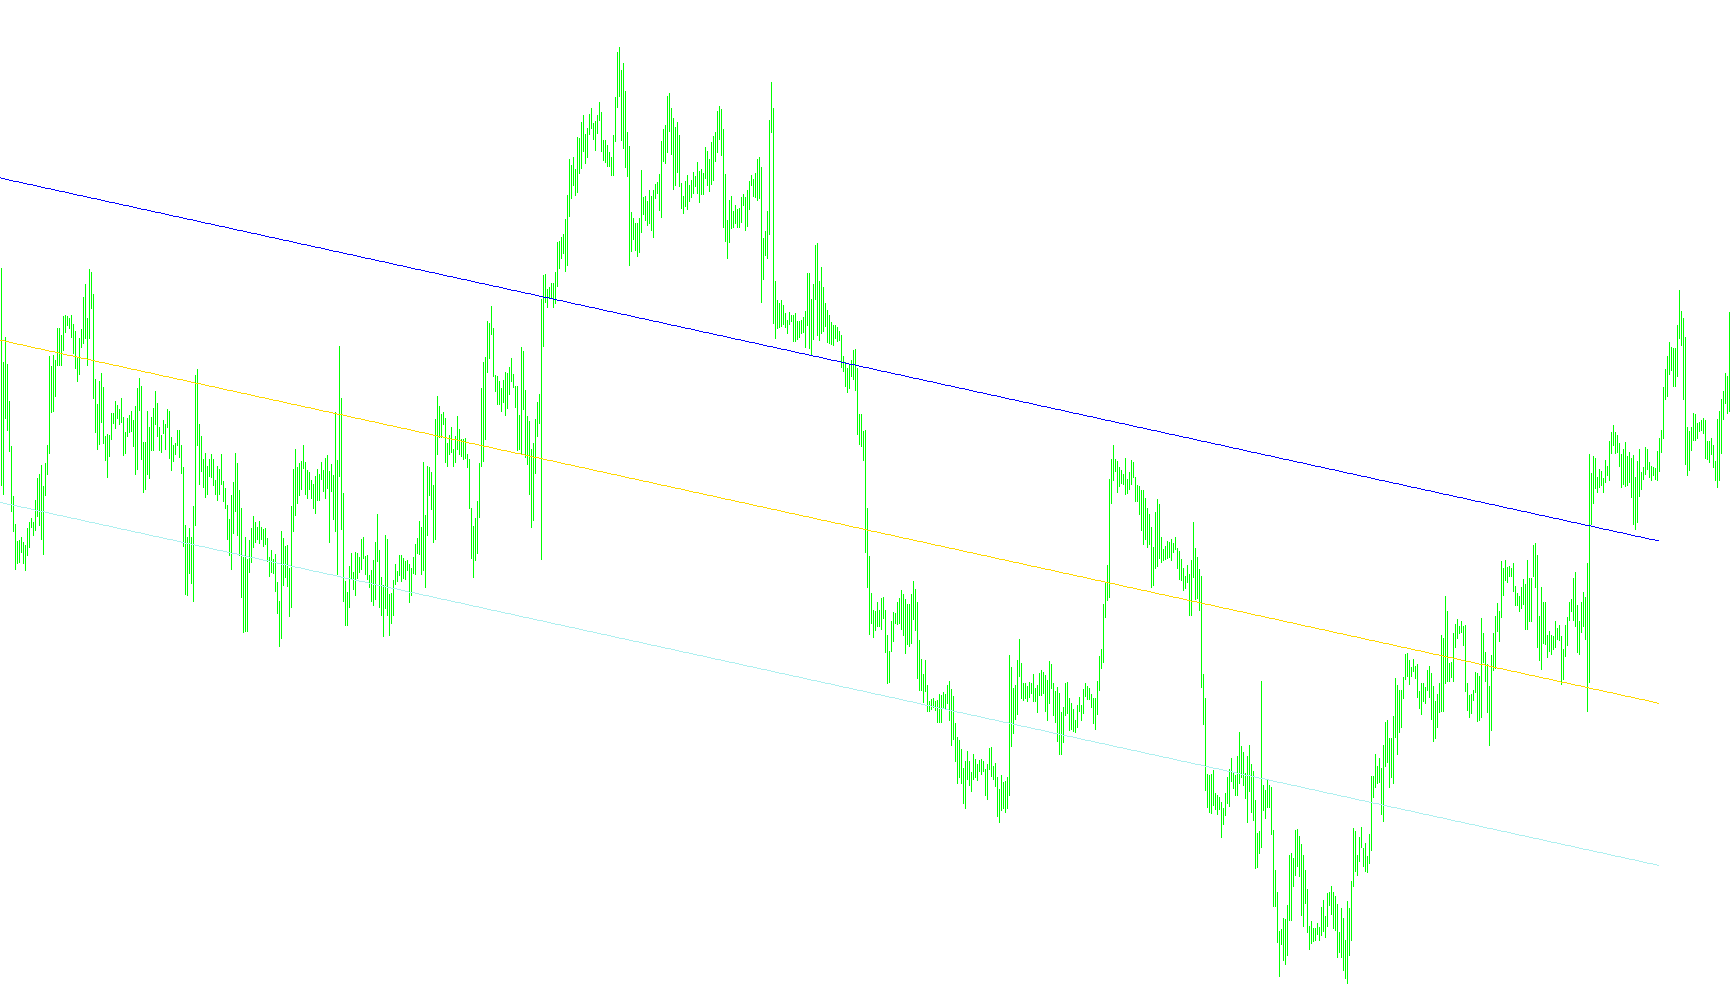
This script is a sophisticated mathematical tool designed to analyze financial price movements by identifying underlying trends and predicting potential price boundaries. Unlike standard moving averages that simply follow the past, this tool uses advanced regression analysis to model the "shape" of price action.
Core Logic Overview
The script functions by treating historical price data as a series of coordinates and attempting to find the most accurate mathematical curve that fits those points. It achieves this through several distinct phases:
1. Data Collection and Customization The tool begins by gathering price data based on your specific preferences—allowing you to choose between various price types (such as Close, Open, High, Low, or averages like Median and Typical). It looks back at a set number of historical bars to build its mathematical model.
2. Polynomial Regression Modeling Instead of drawing a straight line, the script constructs a "Polynomial" curve. By using a user-defined degree, the tool can adjust the complexity of the curve:
- A lower degree creates a simpler, smoother trend.
- A higher degree allows the curve to "bend" more accurately to capture complex fluctuations in the market.
3. The Gaussian Elimination Process To find the perfect curve, the script performs a high-level mathematical operation known as Gaussian Elimination. It builds a matrix of data points and systematically solves for the variables required to minimize the distance between the actual price and the predicted trend line. This ensures that the resulting curve represents the most statistically significant path of the price history.
4. Trend Projection (The Primary Line) Once the math is solved, the script plots a primary trend line (represented in Lime Green). This line acts as the "spine" of the current price movement, showing the direction and momentum based on the calculated regression.
5. Volatility Boundaries (The Channels) Beyond just showing the trend, the script calculates the standard deviation of the price from that trend line. It uses this to create two outer boundaries (represented in Gold):
- Upper Boundary: The projected "ceiling" of the price movement.
- Lower Boundary: The projected "floor" of the price movement.
Summary for the User
In plain terms, this script acts as a dynamic trend corridor. It mathematically calculates the "true" path of the market and creates a channel around it. By looking at where the price sits relative to these lines, you can visualize whether the current movement is staying within the expected statistical norm or if it is breaking out into new territory.
//----
#property indicator_chart_window
#property indicator_buffers 3
#property indicator_color1 LimeGreen
#property indicator_color2 Gold
#property indicator_color3 Gold


extern int degree = 1; // Èçìåíÿåòñÿ îò 1 äî 61
extern double kstd = 1.0;
extern string data = "2009.02.25 16:00";  // Ñòðîêà â ôîðìàòå "yyyy.mm.dd hh:mi".
extern int Applied_price=0;               // èñïîëüçóåìàÿ öåíà:
                                          // 0-CLOSE; 1-OPEN; 2-HIGH; 3-LOW; 4-MEDIAN; 5-TYPICAL; 6-WEIGHTED;
extern int bars = 40;
extern int shift = 0;


//-----
double fx[],sqh[],sql[];

double ai[][65],b[],c[],x[],y[],sx[];
double sum;
int ip,p,n,f;
double qq,mm,tt;
int ii,jj,kk,ll,nn;
double sq;

string symbol;
int i0 = 0;
datetime
      prevtime1=0;


//+------------------------------------------------------------------+
//| Custom indicator initialization function                         |
//+------------------------------------------------------------------+
int init()
{
  ArrayResize(ai,degree+2);
  ArrayResize(b,degree+2);
  ArrayResize(c,degree+2);
  ArrayResize(x,degree+2);
  ArrayResize(y,degree+2);
  ArrayResize(sx,2*(degree+3));

  symbol=Symbol();

  SetIndexBuffer(0, fx); // Áóôåðû ìàññèâîâ èíäèêàòîðà
  SetIndexBuffer(1, sqh);
  SetIndexBuffer(2, sql);

  SetIndexStyle(0, DRAW_LINE);
  SetIndexStyle(1, DRAW_LINE);
  SetIndexStyle(2, DRAW_LINE);

  SetIndexEmptyValue(0, 0.0);
  SetIndexEmptyValue(1, 0.0);
  SetIndexEmptyValue(2, 0.0);

  SetIndexShift(0, shift);
  SetIndexShift(1, shift);
  SetIndexShift(2, shift);


  return(0);
}

//+------------------------------------------------------------------+
//| Custom indicator deinitialization function                       |
//+------------------------------------------------------------------+
int deinit()
{
  //clear();
  return(0);
}

//+------------------------------------------------------------------+
//| Custom indicator iteration function                              |
//+------------------------------------------------------------------+
int start()
{
  if (Bars < bars) return;
   if(prevtime1==iTime(NULL,0,0))
   {
      prevtime1=iTime(NULL,0,0);
      return(0);
   }
   else
   {
      prevtime1=iTime(NULL,0,0);
      if(data!="")
         bars=iBarShift(NULL,0,StrToTime(data));
   }
//----

  int mi; // ïåðåìåííàÿ èñïîëüçóþùàÿñÿ òîëüêî â start
  ip = bars;
  p=ip; // òèïà ïðèñâàèâàíèå
  sx[1]=p+1; // ïðèìå÷àíèå - [] - îçíà÷àåò ìàññèâ
  nn = degree+1;

  SetIndexDrawBegin(0, Bars-p-1);
  SetIndexDrawBegin(1, Bars-p-1);
  SetIndexDrawBegin(2, Bars-p-1);

//----------------------sx-------------------------------------------------------------------
  for(mi=1;mi<=nn*2-2;mi++) // ìàòåìàòè÷åñêîå âûðàæåíèå - äëÿ âñåõ mi îò 1 äî nn*2-2
  {
    sum=0;
    for(n=i0;n<=i0+p;n++)
    {
       sum+=MathPow(n,mi);
    }
    sx[mi+1]=sum;
  }
  //----------------------syx-----------
  for(mi=1;mi<=nn;mi++)
  {
    sum=0.00000;
    for(n=i0;n<=i0+p;n++)
    {

       if(mi==1) sum+=fPrice(symbol,n);
       else sum+=fPrice(symbol,n)*MathPow(n,mi-1);
    }
    b[mi]=sum;
  }
//===============Matrix=======================================================================================================
  for(jj=1;jj<=nn;jj++)
  {
    for(ii=1; ii<=nn; ii++)
    {
       kk=ii+jj-1;
       ai[ii,jj]=sx[kk];
    }
  }
//===============Gauss========================================================================================================
  for(kk=1; kk<=nn-1; kk++)
  {
    ll=0;
    mm=0;
    for(ii=kk; ii<=nn; ii++)
    {
       if(MathAbs(ai[ii,kk])>mm)
       {
          mm=MathAbs(ai[ii,kk]);
          ll=ii;
       }
    }
    if(ll==0) return(0);
    if (ll!=kk)
    {
       for(jj=1; jj<=nn; jj++)
       {
          tt=ai[kk,jj];
          ai[kk,jj]=ai[ll,jj];
          ai[ll,jj]=tt;
       }
       tt=b[kk];
       b[kk]=b[ll];
       b[ll]=tt;
    }
    for(ii=kk+1;ii<=nn;ii++)
    {
       qq=ai[ii,kk]/ai[kk,kk];
       for(jj=1;jj<=nn;jj++)
       {
          if(jj==kk) ai[ii,jj]=0;
          else ai[ii,jj]=ai[ii,jj]-qq*ai[kk,jj];
       }
       b[ii]=b[ii]-qq*b[kk];
    }
  }
  x[nn]=b[nn]/ai[nn,nn];
  for(ii=nn-1;ii>=1;ii--)
  {
    tt=0;
    for(jj=1;jj<=nn-ii;jj++)
    {
       tt=tt+ai[ii,ii+jj]*x[ii+jj];
       x[ii]=(1/ai[ii,ii])*(b[ii]-tt);
    }
  }
//===========================================================================================================================
  for(n=i0;n<=i0+p;n++)
  {
    sum=0;
    for(kk=1;kk<=degree;kk++)
    {
       sum+=x[kk+1]*MathPow(n,kk);
    }
    fx[n]=x[1]+sum;
  }
//-----------------------------------Std-----------------------------------------------------------------------------------
  sq=0.0;
  for(n=i0;n<=i0+p;n++)
  {
    sq+=MathPow(fPrice(symbol,n)-fx[n],2);
  }
  sq=MathSqrt(sq/(p+1))*kstd;

  for(n=i0;n<=i0+p;n++)
  {
    sqh[n]=fx[n]+sq;
    sql[n]=fx[n]-sq;
  }
  return(0);
}
//+------------------------------------------------------------------+
//+------------------------------------------------------------------+
// Âîçâðàùàåò èñïîëüçóåìóþ öåíó äëÿ ðàñ÷åòà èíäèêàòîðà
double fPrice(string symbol, int bar)
{
 double price;
 switch (Applied_price)
 {
  case PRICE_CLOSE:    price=iClose(symbol,0,bar); break;
  case PRICE_OPEN:     price=iOpen(symbol,0,bar); break;
  case PRICE_HIGH:     price=iHigh(symbol,0,bar); break;
  case PRICE_LOW:      price=iLow(symbol,0,bar); break;
  case PRICE_MEDIAN:   price=(iHigh(symbol,0,bar)+iLow(symbol,0,bar))/2; break;
  case PRICE_TYPICAL:  price=(iHigh(symbol,0,bar)+iLow(symbol,0,bar)+iClose(symbol,0,bar))/3; break;
  case PRICE_WEIGHTED: price=(iHigh(symbol,0,bar)+iLow(symbol,0,bar)+iClose(symbol,0,bar)+iClose(symbol,0,bar))/4;
 }
 return(price);
}
Comments