Ichi_KUMOGD_sw
Download script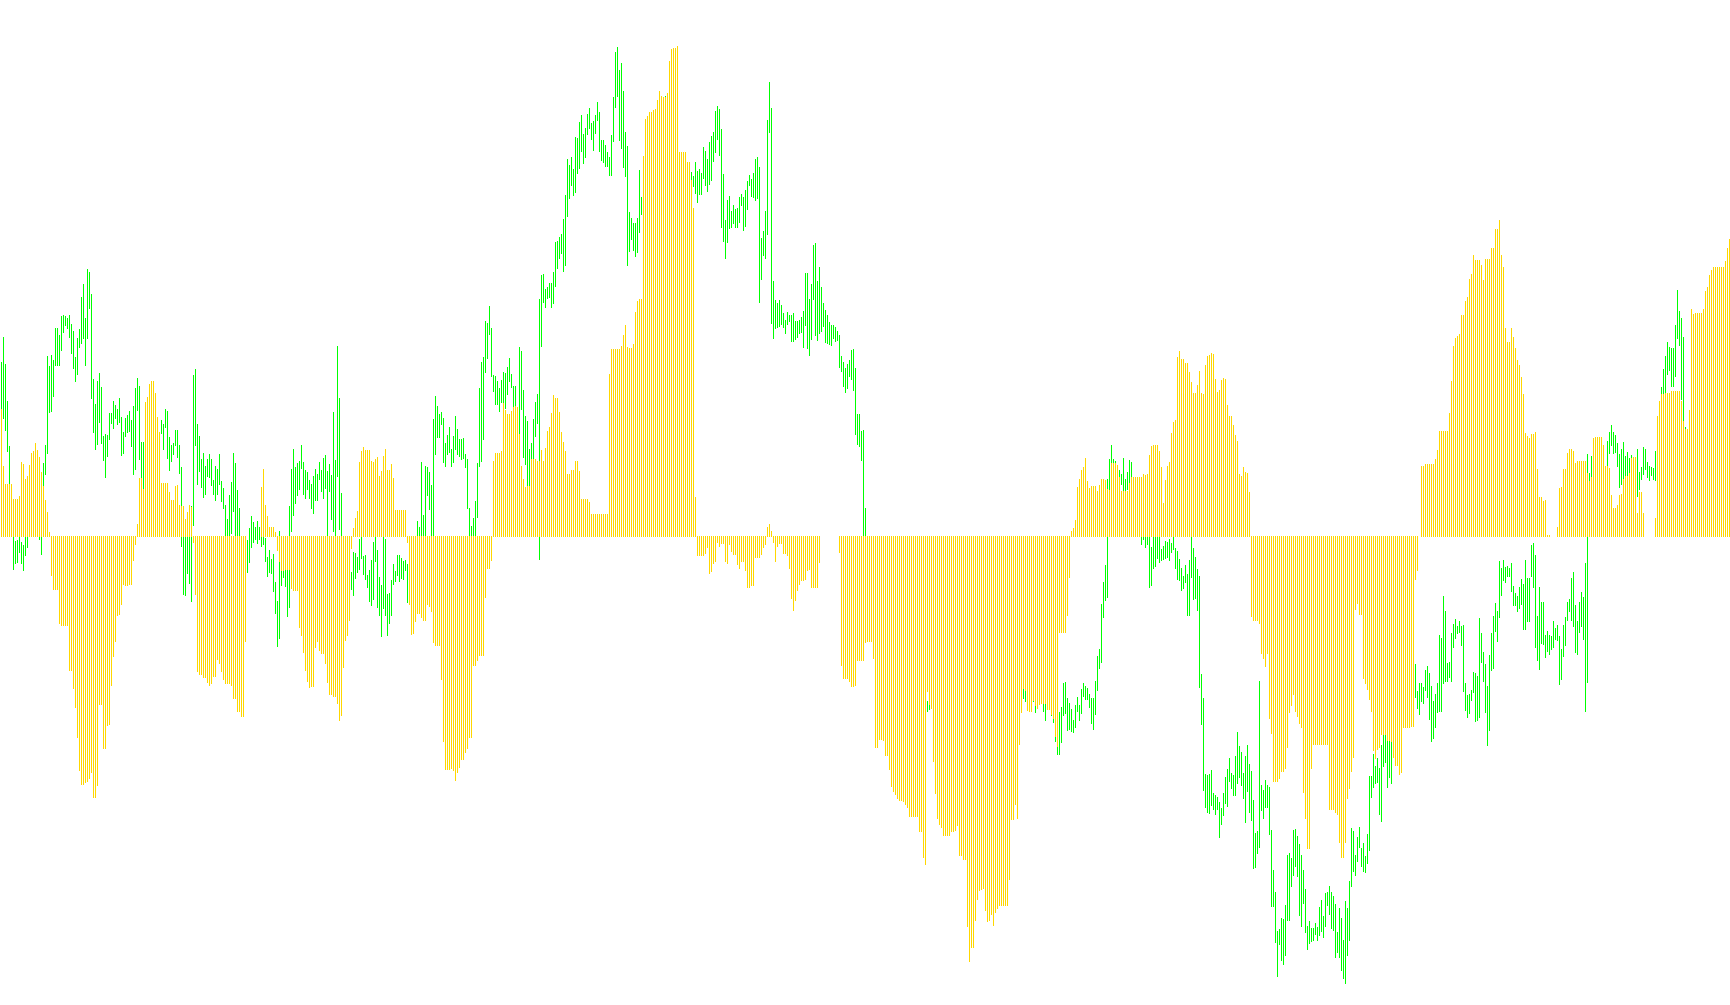
This script is designed as a specialized technical analysis tool for the MetaTrader platform. It focuses on a specific component of the Ichimoku Kinko Cloud system, specifically calculating the "Kumo" (Cloud) dynamics to help traders visualize market trends and potential volatility.
How it Works
The logic follows a structured process to determine the distance between two key trend lines:
1. Data Input Parameters The script uses three primary time-based settings to calculate its values:
- Tenkan (Short-term): A fast-moving average that reacts quickly to recent price changes.
- Kijun (Medium-term): A slightly slower average used to identify the broader trend.
- Senkou (Long-term): A much larger timeframe used to define the ultimate "boundary" of the market.
2. The Calculation Logic Instead of simply plotting a single line, this script calculates the mathematical difference between two specific components of the Ichimoku Cloud:
- It identifies the "Senkou Span A" and the "Senkou Span B."
- It subtracts the value of Span B from Span A at a specific point in time (shifted back by a user-defined amount).
3. Visual Output The resulting value is displayed as a Histogram. Rather than showing you the raw price, it shows you the gap or thickness between these two trend boundaries.
What This Means for the User
By looking at this histogram, you are essentially viewing the "width" of the cloud. In professional trading terms:
- Expanding Bars: When the histogram grows taller, it indicates that the price range is widening, often suggesting a period of high volatility or a strong breakout in a specific direction.
- Contracting Bars: When the bars shrink toward zero, it suggests that the market trend is tightening or stabilizing, which may precede a period of consolidation or a potential reversal.
The script essentially simplifies complex cloud calculations into a single visual gauge, allowing you to see the "pressure" and "space" of the market trend at a glance.
//+------------------------------------------------------------------+
//| KUMO                                                    MACD.mq4 |
//+------------------------------------------------------------------+
//2008forextsd

#property copyright "Copyright © 2006, MetaQuotes Software Corp."
#property link      "http://www.metaquotes.net"

#property indicator_separate_window

#property indicator_buffers 1
#property indicator_color1 RoyalBlue

extern int Tenkan=9;
extern int Kijun=26;
extern int Senkou=52;
extern int KumoShift=26;

double ExtMapBuffer1[];

//+------

int init()
  {


  SetIndexBuffer    (0,ExtMapBuffer1);
  SetIndexStyle     (0,DRAW_HISTOGRAM);
  SetIndexDrawBegin (0,Senkou);
  SetIndexShift     (0,KumoShift);

IndicatorShortName("KUMO Ichi ("+Tenkan+","+Kijun+","+Senkou+"),"+KumoShift+": ");

   return(0);
  }

//+----------

int start()
  {
   int i,limit,counted_bars=IndicatorCounted();

   if(counted_bars<0) return(-1);
   if(counted_bars>0) counted_bars--;

   limit=Bars-counted_bars;


   for (i=limit; i>=0; i--)
     {

  ExtMapBuffer1[i]  = iIchimoku(NULL, 0, Tenkan, Kijun, Senkou, MODE_SENKOUSPANA, i-Kijun)-
                      iIchimoku(NULL, 0, Tenkan, Kijun, Senkou, MODE_SENKOUSPANB, i-Kijun);
      }


  return(0);
 }
//+-----------
Comments