iMACross_v2
Download script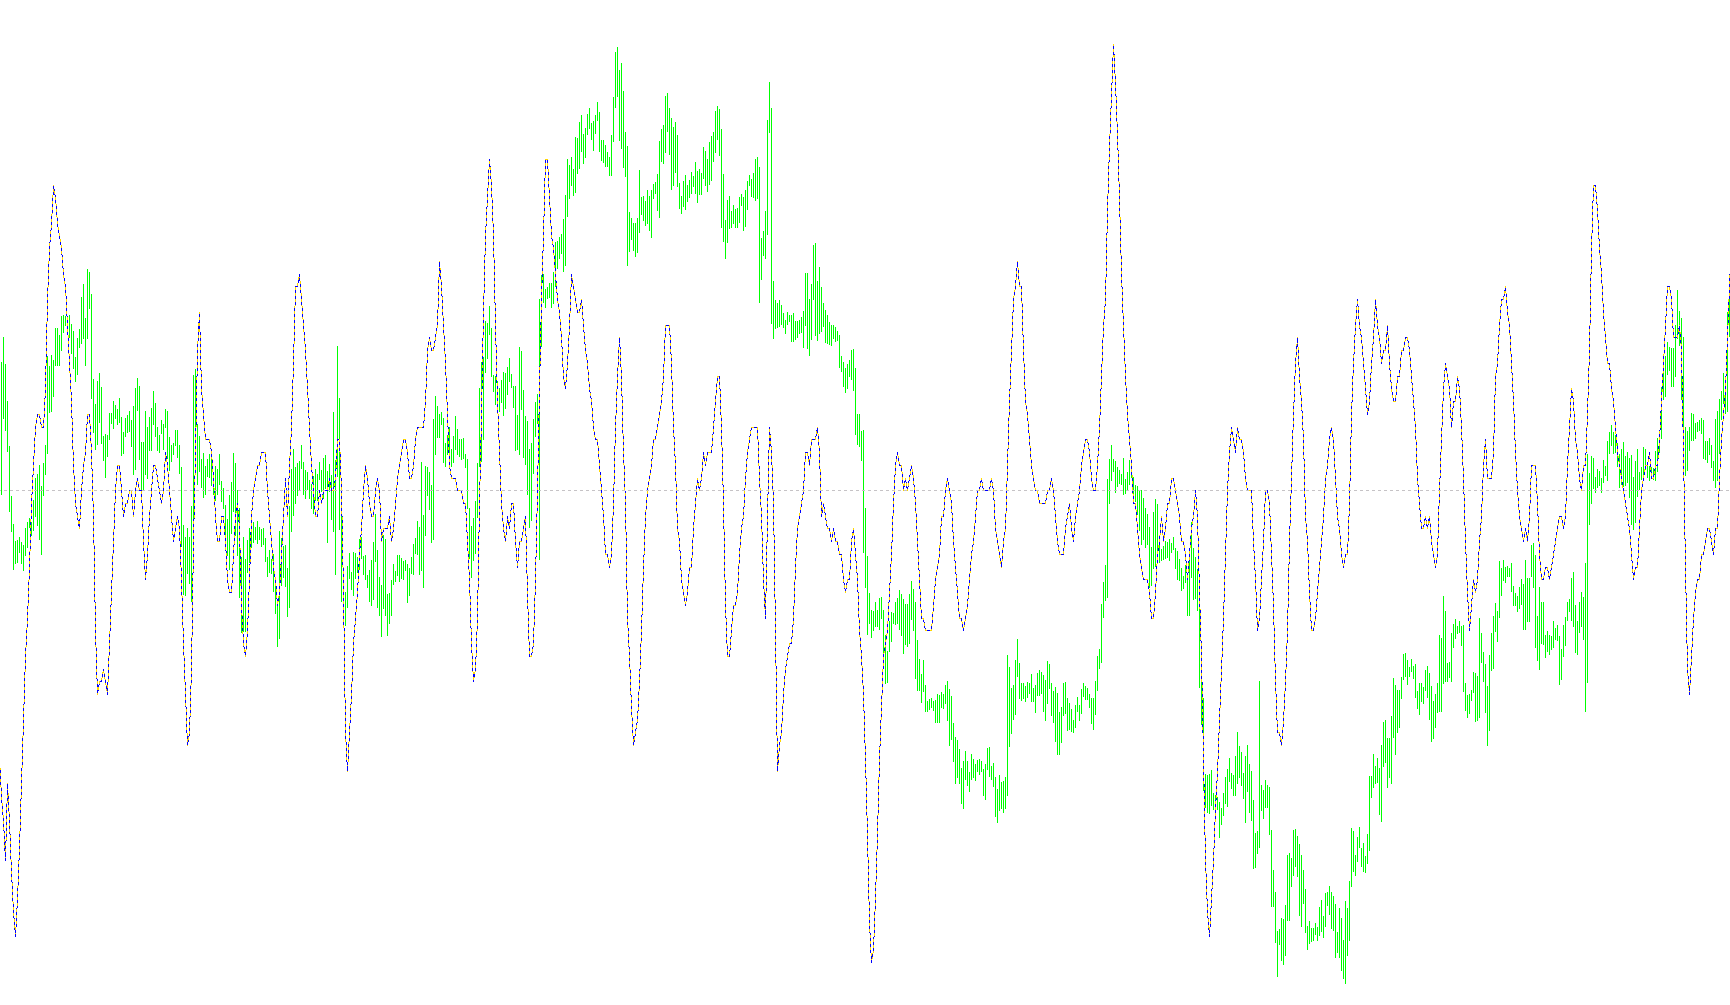
This tool is designed to help traders visualize price momentum and identify potential trend shifts by analyzing the relationship between two different moving averages. Instead of looking at simple price action, it focuses on the "gap" between fast-moving data and slow-moving data to highlight market dynamics in a separate window on your chart.
Core Logic and Functionality
The script operates based on three primary components:
1. The Moving Averages (Fast vs. Slow) The tool calculates two distinct moving averages simultaneously.
- The Fast Average: Tracks short-term price changes quickly.
- The Slow Average: Tracks the broader, longer-term trend.
By comparing these two, the script determines how aggressively the current price is moving relative to its historical average. When the fast average moves significantly away from the slow average, it indicates a strong momentum in that direction.
2. The Difference Calculation (MACD Logic) The primary line displayed by this indicator represents the mathematical difference between these two averages. Rather than showing you the averages themselves, it shows you the "distance" between them.
- If the distance is increasing, it suggests the trend is gaining strength.
- If the distance is shrinking, it suggests the trend may be losing steam or reversing.
3. The Signal Line (Smoothing) To make the data easier to read and to filter out minor market "noise," the script takes that difference calculation and applies a secondary smoothing process. This creates a "Signal" line. By observing the relationship between the main difference line and this signal line, traders can look for specific crossover points which often serve as visual cues for entering or exiting a trade.
Customization Options
The script provides several flexible parameters to tailor the logic to different trading styles:
- Periods: You can adjust how many past bars are used to calculate the "Fast" and "Slow" averages. Shorter periods make the indicator more reactive, while longer periods make it smoother and less prone to false signals.
- Calculation Types: The tool allows you to choose different mathematical methods (such as Simple, Exponential, or Linear Weighted) for calculating those averages, allowing you to prioritize either recent price data or a more balanced historical view.
Summary for the User
In short, this script translates complex price movements into a simplified visual gap. It helps you see whether the market is currently "pulling away" from its average or returning toward it, providing a clearer picture of momentum than looking at a standard price chart alone.
//+------------------------------------------------------------------+
//|                                                     iMACross.mq4 |
//|                                Copyright © 2005, David W. Thomas |
//|                                Copyright © 2005, firedave - MOD  |
//|                                           mailto:davidwt@usa.net |
//|                                    mailto:firedave@fx-review.com |
//+------------------------------------------------------------------+
// This is the correct computation and display of MACD,
// that modified to a MA Cross Indicator
#property copyright "Copyright © 2005, Metaquotes"
#property link      "mailto:metaquotes@metaquotes.net"
//----
#property indicator_separate_window
#property indicator_buffers 1
#property indicator_color1 Blue
#property indicator_color2 Blue
//---- input parameters
extern int       FastMAPeriod=4;
extern int       SlowMAPeriod=14;
extern int       FastMAType=1;
extern int       SlowMAType=1;
//---- buffers
double MACDLineBuffer[];
double SignalLineBuffer[];
int    FastMAMode;
int    SlowMAMode;
string strFastMAType;
string strSlowMAType;
//---- variables
double alpha=0;
double alpha_1=0;
int    SignalMAPeriod=1;
//+------------------------------------------------------------------+
//| Custom indicator initialization function                         |
//+------------------------------------------------------------------+
int init()
  {
   switch(FastMAType)
     {
      case 1: strFastMAType="S"; FastMAMode=MODE_SMA; break;
      case 2: strFastMAType="E"; FastMAMode=MODE_EMA; break;
      case 3: strFastMAType="W"; FastMAMode=MODE_LWMA; break;
      default: strFastMAType="S"; FastMAMode=MODE_SMA; break;
     }
   switch(SlowMAType)
     {
      case 1: strSlowMAType="S"; SlowMAMode=MODE_SMA; break;
      case 2: strSlowMAType="E"; SlowMAMode=MODE_EMA; break;
      case 3: strSlowMAType="W"; SlowMAMode=MODE_LWMA; break;
      default: strSlowMAType="S"; SlowMAMode=MODE_SMA; break;
     }
   IndicatorDigits(MarketInfo(Symbol(),MODE_DIGITS)+1);
//---- indicators
   SetIndexStyle(0,DRAW_LINE);
   SetIndexBuffer(0,MACDLineBuffer);
   SetIndexDrawBegin(0,SlowMAPeriod);
   SetIndexStyle(1,DRAW_LINE,STYLE_DOT);
   SetIndexBuffer(1,SignalLineBuffer);
   SetIndexDrawBegin(1,SlowMAPeriod+SignalMAPeriod);
   SetIndexDrawBegin(2,SlowMAPeriod+SignalMAPeriod);
//---- name for DataWindow and indicator subwindow label
   IndicatorShortName("MA Cross ("+FastMAPeriod+"-"+strFastMAType+","+SlowMAPeriod+"-"+strSlowMAType+") ");
   SetIndexLabel(0,"DPO");
   SetIndexLabel(1,"Signal");
   SetLevelStyle(STYLE_DOT,1,Silver);
   SetLevelValue(0,0);
//----
   alpha=2.0/(SignalMAPeriod + 1.0);
   alpha_1=1.0 - alpha;
//----
   return(0);
  }
//+------------------------------------------------------------------+
//| Custor indicator deinitialization function                       |
//+------------------------------------------------------------------+
int deinit()
  {
//----
//----
   return(0);
  }
//+------------------------------------------------------------------+
//| Custom indicator iteration function                              |
//+------------------------------------------------------------------+
int start()
  {
   int limit;
   int counted_bars=IndicatorCounted();
//---- check for possible errors
   if (counted_bars<0) return(-1);
//---- last counted bar will be recounted
   if (counted_bars>0) counted_bars--;
   limit=Bars - counted_bars;
//----
   for(int i=limit; i>=0; i--)
     {
      MACDLineBuffer[i]=MathRound((iMA(NULL,0,FastMAPeriod,0,FastMAMode,PRICE_CLOSE,i) - iMA(NULL,0,SlowMAPeriod,0,SlowMAMode,PRICE_CLOSE,i))*10000);
      SignalLineBuffer[i]=alpha*MACDLineBuffer[i] + alpha_1*SignalLineBuffer[i+1];
     }
//----
   return(0);
  }
//+------------------------------------------------------------------+
Comments