Inverse fisher transform of Stochastic
Download script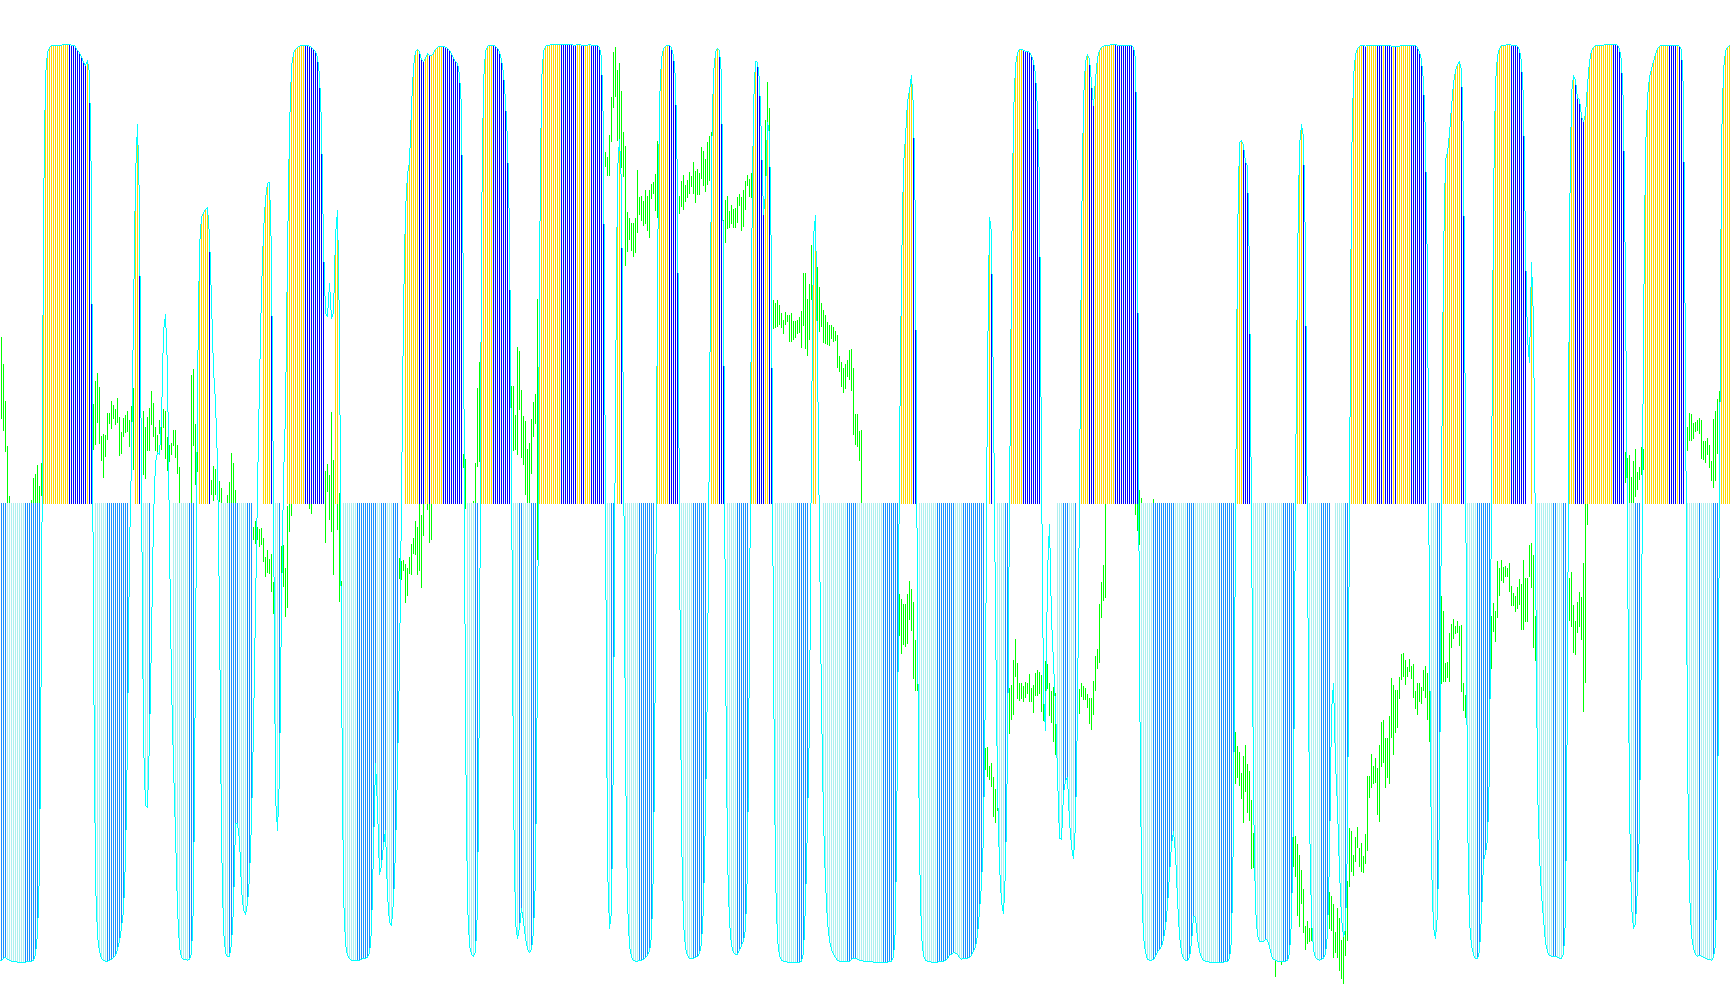
This custom indicator is designed to provide a sophisticated visual analysis of market momentum by combining two well-known mathematical concepts: the Stochastic Oscillator and the Inverse Fisher Transform. The primary goal of this tool is to smooth out market "noise" while highlighting clear directional shifts and trends.
Core Logical Flow
1. Data Foundation (The Stochastic Input) The logic begins by pulling data from a standard Stochastic Oscillator. Instead of using the raw percentage values typically seen in trading, the script centers the data around a zero-point. This establishes a baseline where the market's relative position is evaluated objectively, making it easier to identify neutral zones versus bullish or bearish territory.
2. Smoothing and Trend Filtering To ensure the indicator doesn't react too wildly to minor price fluctuations (whipsaws), the script applies a Moving Average to the processed Stochastic data. This acts as a "filter," ensuring that the final output reflects sustained momentum rather than momentary spikes.
3. The Mathematical Transformation The core of this tool is the application of an Inverse Fisher Transform. This specific mathematical operation is used to convert the smoothed trend data into a more aggressive, bounded signal. By doing this, the indicator "stretches" the price movement into a visible range (between -1 and 1). It effectively highlights the strength of the current trend, making it easier for a trader to see when momentum is accelerating or exhausting.
4. Visual Representation and Signal Logic The final output is rendered as a dynamic histogram on a separate window. The script uses specific logic to color and display these bars:
- Directional Movement: It compares the current value against the previous candle's value. If the momentum is increasing, it highlights that movement; if it is decreasing, it captures that decline.
- Zero-Line Interaction: The script distinguishes between positive and negative momentum zones. When values cross above or below the zero line, it provides a visual cue of a potential trend reversal.
- Dynamic Zones: The indicator includes a "Levels" system that draws shaded background rectangles on your chart. These zones help define the "active" trading area, providing a clear visual boundary for where the most significant price action is occurring.
Summary for the Trader
Instead of looking at a messy, fluctuating oscillator, this script provides a refined momentum map. It takes standard market data, smooths out the "jitter," applies a mathematical transform to emphasize trend strength, and presents it as a clear visual histogram with defined zones. This allows you to more easily identify when a trend is gaining strength, losing steam, or potentially reversing.
//+------------------------------------------------------------------+
//|                       Inverse fisher transform of Stochastic.mq4 |
//|                                                           mladen |
//+------------------------------------------------------------------+
#property  copyright "mladen"
#property  link      "mladenfx@gmail.com"

#property  indicator_separate_window
#property  indicator_buffers   5
#property  indicator_color1    Green
#property  indicator_color2    Green
#property  indicator_color3    Red
#property  indicator_color4    Red
#property  indicator_color5    DimGray
#property  indicator_width1    2
#property  indicator_width3    2
#property  indicator_width5    2
#property  indicator_maximum   1
#property  indicator_minimum  -1

//
//
//
//
//

extern int    StochKPeriod  =  14;
extern int    StochSlowing  =  3;
extern int    StochPrice    =  0;
extern int    MAPeriod      =  9;
extern int    MAMode        =  MODE_LWMA;
extern bool   ShowHistogram =  true;
extern bool   ShowLevels    =  true;
extern double Level1        =  0.5;
extern double Level2        =  0.0;
extern double Level3        = -0.5;
extern color  ZoneColor     = C'30,33,36';

//
//
//
//
//

double   buffer1[];
double   buffer2[];
double   buffer3[];
double   buffer4[];
double   buffer5[];
double   buffer6[];
double   buffer7[];

//
//
//
//
//

string ShortName;

//+------------------------------------------------------------------+
//|                                                                  |
//+------------------------------------------------------------------+
//
//
//
//
//

int init()
{
   IndicatorBuffers(7);
   SetIndexBuffer(0,buffer1);
   SetIndexBuffer(1,buffer2);
   SetIndexBuffer(2,buffer3);
   SetIndexBuffer(3,buffer4);
   SetIndexBuffer(4,buffer5);
   SetIndexBuffer(5,buffer6);
   SetIndexBuffer(6,buffer7);
      SetIndexStyle(0,DRAW_HISTOGRAM);
      SetIndexStyle(1,DRAW_HISTOGRAM);
      SetIndexStyle(2,DRAW_HISTOGRAM);
      SetIndexStyle(3,DRAW_HISTOGRAM);

   //
   //
   //
   //
   //

   ShortName=MakeUniqueName("Inverse fisher Stochastic "," ("+StochKPeriod+","+StochSlowing+","+MAPeriod+")");
   IndicatorShortName(ShortName);
   return(0);
}
int deinit()
{
   DeleteBounds();
   return(0);
}

//+------------------------------------------------------------------+
//|                                                                  |
//+------------------------------------------------------------------+
//
//
//
//
//

int start()
{
   int    limit, i;
   int    counted_bars=IndicatorCounted();

   if(counted_bars<0) return(-1);
   if(counted_bars>0) counted_bars--;
           limit=Bars-counted_bars;

   //
   //
   //
   //
   //

   for(i=limit; i>=0; i--) buffer7[i] = 0.1*(iStochastic(NULL,0,StochKPeriod,1,StochSlowing,MODE_SMA,StochPrice,MODE_MAIN,i)-50);
   for(i=limit; i>=0; i--)
   {
      buffer6[i] = iMAOnArray(buffer7,0,MAPeriod,0,MAMode,i);
      buffer5[i] = (MathExp(2*buffer6[i])-1)/(MathExp(2*buffer6[i])+1);

      //
      //
      //
      //
      //

      if(ShowHistogram)
      {
         if(buffer5[i]==buffer5[i+1])
         {
            buffer1[i]=buffer1[i+1];
            buffer2[i]=buffer2[i+1];
            buffer3[i]=buffer3[i+1];
            buffer4[i]=buffer4[i+1];
               continue;
         }

         //
         //
         //
         //
         //

            buffer1[i]=EMPTY_VALUE;
            buffer2[i]=EMPTY_VALUE;
            buffer3[i]=EMPTY_VALUE;
            buffer4[i]=EMPTY_VALUE;
            if(ShowLevels)
               if((buffer5[i]<Level1) && (buffer5[i]>Level3))
                  continue;

            //
            //
            //
            //
            //

            if(buffer5[i]<0)
            {
               if (buffer5[i]<buffer5[i+1]) buffer3[i]=buffer5[i];
               if (buffer5[i]>buffer5[i+1]) buffer4[i]=buffer5[i];
            }
            if(buffer5[i]>0)
            {
               if (buffer5[i]<buffer5[i+1]) buffer2[i]=buffer5[i];
               if (buffer5[i]>buffer5[i+1]) buffer1[i]=buffer5[i];
            }
      }
   }

   //
   //
   //
   //
   //

   if (ShowLevels) UpdateBounds();
   return(0);
}

//+------------------------------------------------------------------+
//|                                                                  |
//+------------------------------------------------------------------+
//
//
//
//
//

string MakeUniqueName(string first, string rest)
{
   string result = first+(MathRand()%1001)+rest;

   while (WindowFind(result)> 0)
          result = first+(MathRand()%1001)+rest;
   return(result);
}


//+------------------------------------------------------------------+
//|                                                                  |
//+------------------------------------------------------------------+
//
//
//
//
//

void DeleteBounds()
{
   ObjectDelete(ShortName+"-1");
   ObjectDelete(ShortName+"-2");
   ObjectDelete(ShortName+"-3");
}
void UpdateBounds()
{
   SetUpBound(ShortName+"-1",1          ,Level1);
   SetUpBound(ShortName+"-2",Level2*1.01,Level2*0.99);
   SetUpBound(ShortName+"-3",Level3     ,      -1.00);
}
void SetUpBound(string name, double up, double down)
{
   if (ObjectFind(name) == -1)
      {
         ObjectCreate(name,OBJ_RECTANGLE,WindowFind(ShortName),0,0);
         ObjectSet(name,OBJPROP_PRICE1,up);
         ObjectSet(name,OBJPROP_PRICE2,down);
         ObjectSet(name,OBJPROP_COLOR,ZoneColor);
         ObjectSet(name,OBJPROP_BACK,true);
         ObjectSet(name,OBJPROP_TIME1,iTime(NULL,0,Bars-1));
      }
   if (ObjectGet(name,OBJPROP_TIME2) != iTime(NULL,0,0))
       ObjectSet(name,OBJPROP_TIME2,    iTime(NULL,0,0));
}
Comments