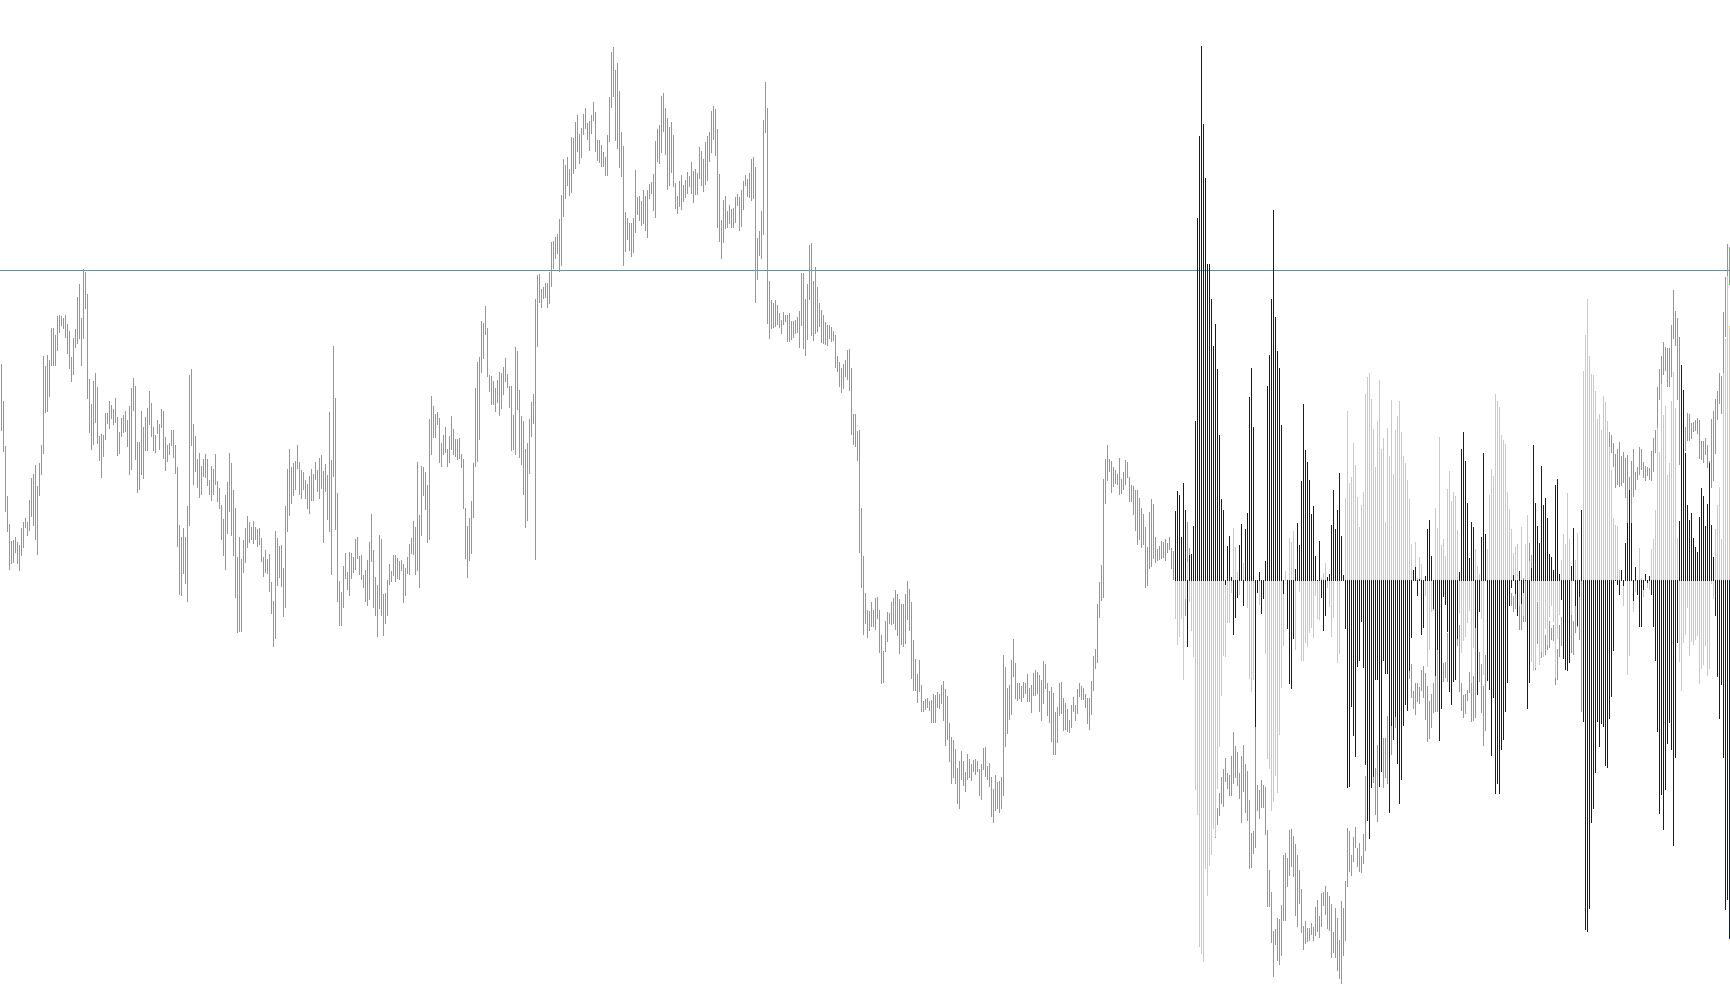
This technical indicator is designed to analyze market trends and momentum by calculating the variance between current price action and established statistical boundaries. It operates in a separate window, providing a visual representation of market "strength" or "deviation" rather than plotting directly on the price candles.
Core Logic and Functionality
The script functions by processing two distinct mathematical components to help traders identify where the market is currently positioned relative to its historical norms:
1. Deviation Analysis (Bands Component) The first part of the logic measures the distance between the current market price and a calculated "band." By subtracting a standard statistical band from the current price, the script determines how far the price has stretched away from its expected path.
- Depending on your settings, it can track deviations based on the High, Low, Open, or Closing prices.
- This helps in identifying overextended markets—essentially showing whether the price is moving aggressively in one direction or staying within a stabilized range.
2. Momentum Balancing (Power Component) The second part of the logic evaluates "Bullish" and "Bearish" power. It calculates the relative strength of buyers versus sellers over a specific period and combines them into a single value.
- By subtracting the Bearish Power from the Bullish Power, it generates a net momentum figure.
- This allows you to see the underlying "pressure" in the market. If one side is significantly stronger than the other, the indicator reflects that imbalance as a histogram.
Visual Representation
The results are displayed as two separate histograms:
- Primary Data: Shows the price-to-band deviation, highlighting how much the market is "stretching."
- Secondary Data: Shows the net power balance, highlighting the "push" behind the current price movement.
Summary for the User
In simple terms, this tool acts as a dual-lens monitor. One lens tells you how far the price has moved away from its average behavior (Deviation), while the other lens tells you how much force is currently driving that movement (Momentum). By observing these two metrics together, traders can better understand if a price move is sustained by strong momentum or if it is becoming overextended and potentially due for a reversal.
//+------------------------------------------------------------------+
//|                                                       iTrend.mq4 |
//|                      Copyright © 2004, MetaQuotes Software Corp. |
//|                                        http://www.metaquotes.net |
//+------------------------------------------------------------------+
#property copyright "Copyright © 2004, MetaQuotes Software Corp."
#property link      "http://www.metaquotes.net"

#property indicator_separate_window
#property indicator_buffers 2
#property indicator_color1 DarkKhaki
#property indicator_color2 Red
//---- input parameters
extern int Bands_Mode_0_2=0;  // =0-2 MODE_MAIN, MODE_LOW, MODE_HIGH
extern int Power_Price_0_6=0; // =0-6 PRICE_CLOSE,PRICE_OPEN,PRICE_HIGH,PRICE_LOW,PRICE_MEDIAN,PRICE_TYPICAL,PRICE_WEIGHTED
extern int Price_Type_0_3=0;  // =0-3 PRICE_CLOSE,PRICE_OPEN,PRICE_HIGH,PRICE_LOW
extern int Bands_Period=20;
extern int Bands_Deviation=2;
extern int Power_Period=13;
extern int CountBars=300;
//---- buffers
double value[];
double value2[];
//+------------------------------------------------------------------+
//| Custom indicator initialization function                         |
//+------------------------------------------------------------------+
int init()
  {
//   string short_name;
//---- indicator line
   IndicatorBuffers(2);
   SetIndexStyle(0,DRAW_HISTOGRAM);
   SetIndexStyle(1,DRAW_HISTOGRAM);
   SetIndexBuffer(0,value);
   SetIndexBuffer(1,value2);
//----

//----
   return(0);
  }
//+------------------------------------------------------------------+
//| Trend                                                         |
//+------------------------------------------------------------------+
int start()
  {
   SetIndexDrawBegin(0,Bars-CountBars+Bands_Period+1);
   SetIndexDrawBegin(1,Bars-CountBars+Bands_Period+1);
   int i,CurrentBar,Bands_Mode,counted_bars=IndicatorCounted();
   double Power_Price,CurrentPrice;
//----
   if(Bars<=Bands_Period) return(0);
//---- initial zero
   if(counted_bars<Bands_Period)
   {
      for(i=1;i<=Bands_Period;i++) value[Bars-i]=0.0;
      for(i=1;i<=Bands_Period;i++) value2[Bars-i]=0.0;
   }
//----
   i=CountBars-Bands_Period-1;
//   if(counted_bars>=Bands_Period) i=Bars-counted_bars-1;


if (Bands_Mode_0_2==1) Bands_Mode=MODE_LOW;
if (Bands_Mode_0_2==2) Bands_Mode=MODE_HIGH;
if (Bands_Mode_0_2==0) Bands_Mode=MODE_MAIN;

if (Power_Price_0_6==1) Power_Price=PRICE_OPEN;
if (Power_Price_0_6==2) Power_Price=PRICE_HIGH;
if (Power_Price_0_6==3) Power_Price=PRICE_LOW;
if (Power_Price_0_6==4) Power_Price=PRICE_MEDIAN;
if (Power_Price_0_6==5) Power_Price=PRICE_TYPICAL;
if (Power_Price_0_6==6) Power_Price=PRICE_WEIGHTED;
if (Power_Price_0_6==6) Power_Price=PRICE_CLOSE;

for (i=CountBars-1; i>=0; i--)
{
  if (Price_Type_0_3==1) CurrentPrice=Open[i];

  if (Price_Type_0_3==2) CurrentPrice=High[i];

  if (Price_Type_0_3==3) CurrentPrice=Low[i];
  if (Price_Type_0_3==0) CurrentPrice=Close[i];

  value[i]=CurrentPrice-iBands(NULL,0,Bands_Period,Bands_Deviation,0,Bands_Mode,Power_Price,i);
  value2[i]=-(iBearsPower(NULL,0,Power_Period,Power_Price,i)+iBullsPower(NULL,0,Power_Period,Power_Price,i));

}


   return(0);
  }
//+------------------------------------------------------------------+
Comments