iTrend1_v1
Download script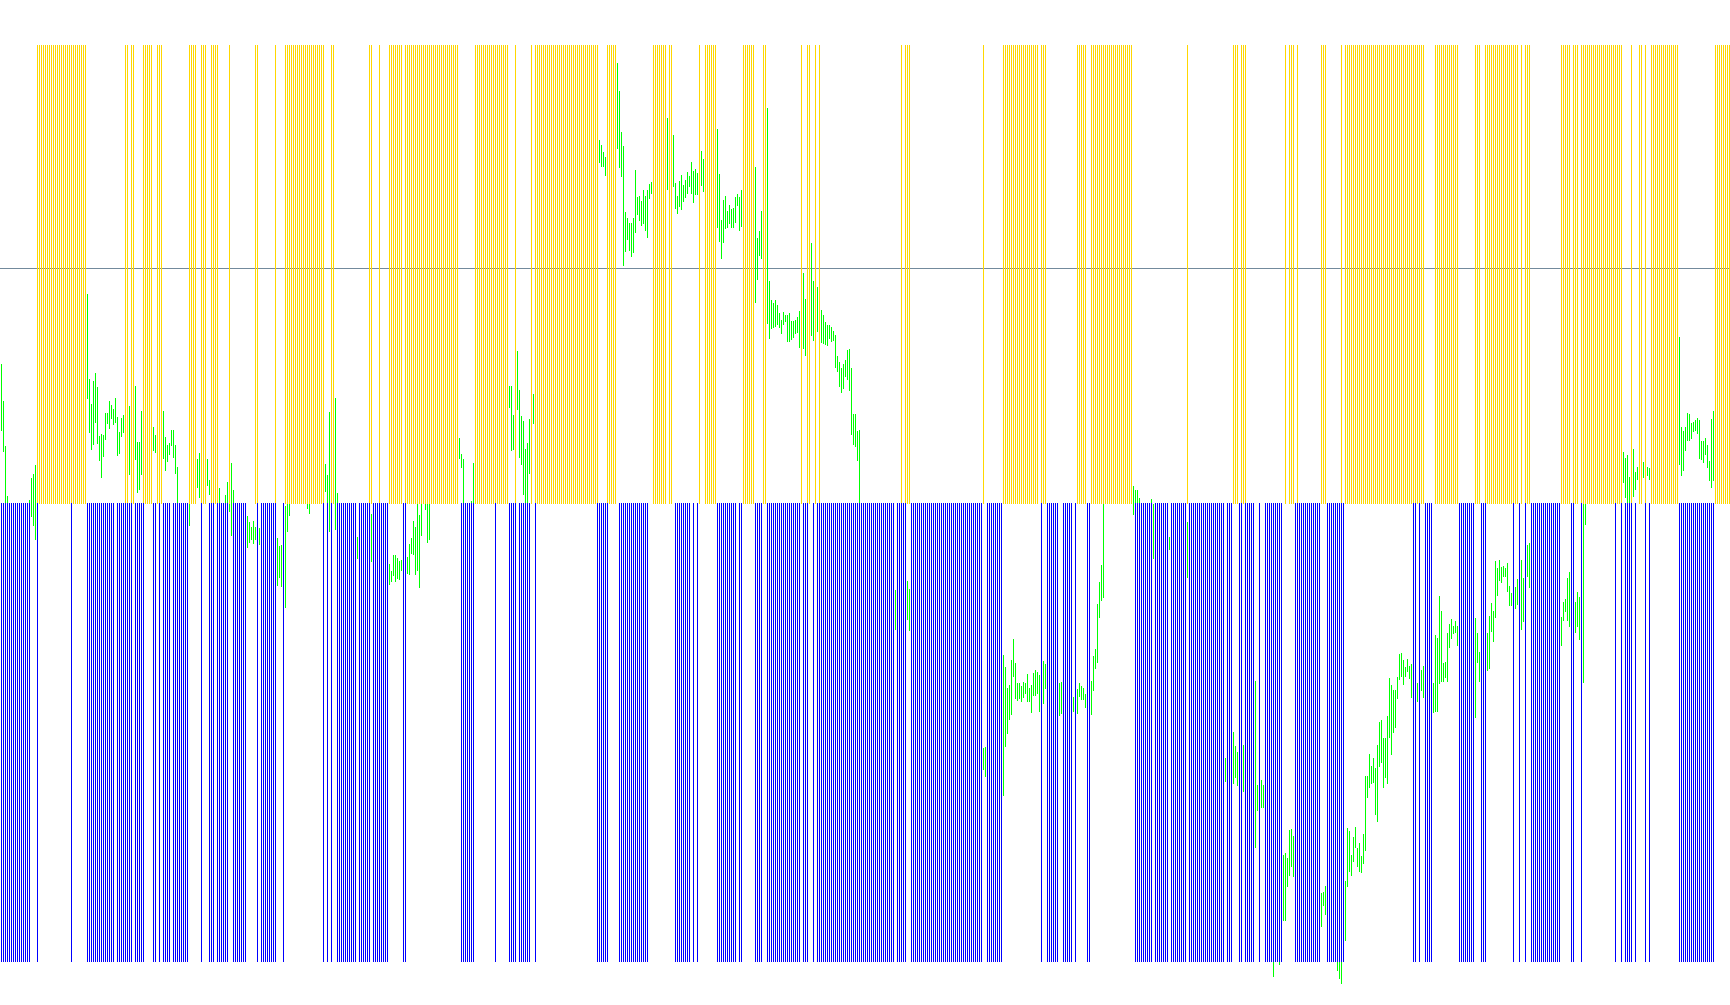
The iTrend_hist indicator is designed to provide traders with a visual representation of market momentum and trend direction by distilling complex price action into a simplified histogram. Instead of cluttered lines on your main chart, it operates in a separate window, offering a cleaner way to identify whether the current market sentiment is leaning towards bullish or bearish territory.
How the Logic Works
The indicator functions by analyzing three distinct components of market data: Bollinger Bands, Bullish Power, and Bearish Power. Here is a breakdown of how these elements interact:
1. Trend Identification (Price vs. Bollinger Bands) The script constantly compares the current market price against a calculated Bollinger Band. By looking at where the price sits in relation to these bands, the logic determines the primary "flow" of the market:
- If the price is positioned above the designated band, it registers a positive trend signal.
- If the price falls below that band, it registers a negative trend signal.
2. Momentum Measurement (Bullish and Bearish Power) To add depth to the trend analysis, the script calculates "Power" metrics. These measure the strength of buyers versus sellers over a specific period. By combining both Bullish and Bearish power, the indicator can sense the intensity of market movement.
3. Visual Output (The Histogram) The final result is translated into two distinct colored histograms (Blue and Red) that appear in your sub-window:
- Blue Histograms: These represent periods where the price action confirms a positive trend relative to the volatility bands.
- Red Histograms: These signify periods where the price action aligns with a negative trend.
Customization Options
The script is highly flexible, allowing you to tailor the logic to different trading styles through several user-adjustable settings:
- Price Types: You can choose which specific price data point (such as Open, High, Low, or Close) the indicator should use for its calculations.
- Period Adjustments: You can modify the look-back periods for both the trend bands and the power calculations to make the indicator more sensitive or more stable depending on your timeframe.
- Deviation & Modes: You can adjust how far the bands spread (deviation) and which specific band (Main, Upper, or Lower) serves as the primary benchmark for the trend logic.
In summary, iTrend_hist acts as a filter that removes market noise, highlighting whether the core "strength" of the move is currently pushing upwards or downwards based on historical volatility and momentum.
/*-----------------------------+
|			       |
| Shared by www.Aptrafx.com    |
|			       |
+------------------------------*/

//+------------------------------------------------------------------+
//|                                                  iTrend_hist.mq4 |
//|                                                                  |
//|                                                                  |
//+------------------------------------------------------------------+
#property copyright "tonyc2a@yahoo.com"
#property link      ""
#property indicator_separate_window
#property indicator_buffers 2
#property indicator_color1 Blue
#property indicator_color2 Red
#property indicator_minimum -1
#property indicator_maximum 1


//---- input parameters
extern double iBandsDeviation=2;
extern int iBandsMode0_2=0;     // 0-2: MODE_MAIN, MODE_LOW, MODE_HIGH
extern int iBandsPrice0_6=0;    // 0-6: PRICE_CLOSE,PRICE_OPEN,PRICE_HIGH,PRICE_LOW,PRICE_MEDIAN,PRICE_TYPICAL,PRICE_WEIGHTED
extern int iBandsPeriod=20;     // 20
extern int iPowerPrice0_6=0;    // 0-6: PRICE_CLOSE,PRICE_OPEN,PRICE_HIGH,PRICE_LOW,PRICE_MEDIAN,PRICE_TYPICAL,PRICE_WEIGHTED
extern int iPowerPeriod=13;     // 13
extern int iPriceType0_3=0;     // 0-3: PRICE_CLOSE,PRICE_OPEN,PRICE_HIGH,PRICE_LOW

//---- buffers
double ExtMapBuffer1[];
double ExtMapBuffer2[];

//+------------------------------------------------------------------+
//| Custom indicator initialization function                         |
//+------------------------------------------------------------------+
int init()
  {
//---- indicators
   IndicatorBuffers(2);
   SetIndexStyle(0,DRAW_HISTOGRAM);
   SetIndexBuffer(0,ExtMapBuffer1);
   SetIndexLabel(0,"Blue");
   SetIndexStyle(1,DRAW_HISTOGRAM);
   SetIndexBuffer(1,ExtMapBuffer2);
   SetIndexLabel(1,"Red");
//----
   IndicatorShortName("iTrend");
//----
   return(0);
  }
//+------------------------------------------------------------------+
//| Custor indicator deinitialization function                       |
//+------------------------------------------------------------------+
int deinit()
  {
//---- TODO: add your code here
//----
   return(0);
  }
//+------------------------------------------------------------------+
//| Custom indicator iteration function                              |
//+------------------------------------------------------------------+
int start()
  {
   int    counted_bars=IndicatorCounted();
//---- TODO: add your code here

   //+----Processes user parameters-------------------------------------+
   double BandsMode,BandsPrice,PowerPrice;

   switch(iBandsMode0_2){
      case 1: BandsMode=MODE_LOWER;
      case 2: BandsMode=MODE_UPPER;
      default: BandsMode=MODE_MAIN;
      } //end switch

   switch(iBandsPrice0_6){
      case 1: BandsPrice=PRICE_OPEN;
      case 2: BandsPrice=PRICE_HIGH;
      case 3: BandsPrice=PRICE_LOW;
      case 4: BandsPrice=PRICE_MEDIAN;
      case 5: BandsPrice=PRICE_TYPICAL;
      case 6: BandsPrice=PRICE_WEIGHTED;
      default: BandsPrice=PRICE_CLOSE;
      } //end switch

   switch(iPowerPrice0_6){
      case 1: PowerPrice=PRICE_OPEN;
      case 2: PowerPrice=PRICE_HIGH;
      case 3: PowerPrice=PRICE_LOW;
      case 4: PowerPrice=PRICE_MEDIAN;
      case 5: PowerPrice=PRICE_TYPICAL;
      case 6: PowerPrice=PRICE_WEIGHTED;
      default: PowerPrice=PRICE_CLOSE;
      } //end switch
   //+------------------------------------------------------------------+

   //+----Main Section--------------------------------------------------+
   double CurrentPrice, value1, value2, x, y;

   for(int i=0;i<=Bars;i++){
      switch(iPriceType0_3){
         case 1: CurrentPrice=Open[i];
         case 2: CurrentPrice=High[i];
         case 3: CurrentPrice=Low[i];
         default: CurrentPrice=Close[i];
         } //end switch

      x=CurrentPrice-iBands(Symbol(),Period(),iBandsPeriod,iBandsDeviation,0,BandsPrice,BandsMode,i);
      y=-(iBullsPower(Symbol(),Period(),iPowerPeriod,PowerPrice,i) + iBearsPower(Symbol(),Period(),iPowerPeriod,PowerPrice,i));

      if(x<0) value1=0;
      if(x>0) value1=1;
      if(y<0) value2=0;
      if(y>0) value2=-1;

      ExtMapBuffer1[i]=value1;
      ExtMapBuffer2[i]=value2;
      } //end for
   //+------------------------------------------------------------------+

   //ObjectCreate("vl",OBJ_VLINE,WindowFind("iTrend"),Time[-1],Close[0]);

//----
   return(0);
  }
//+------------------------------------------------------------------+
Comments