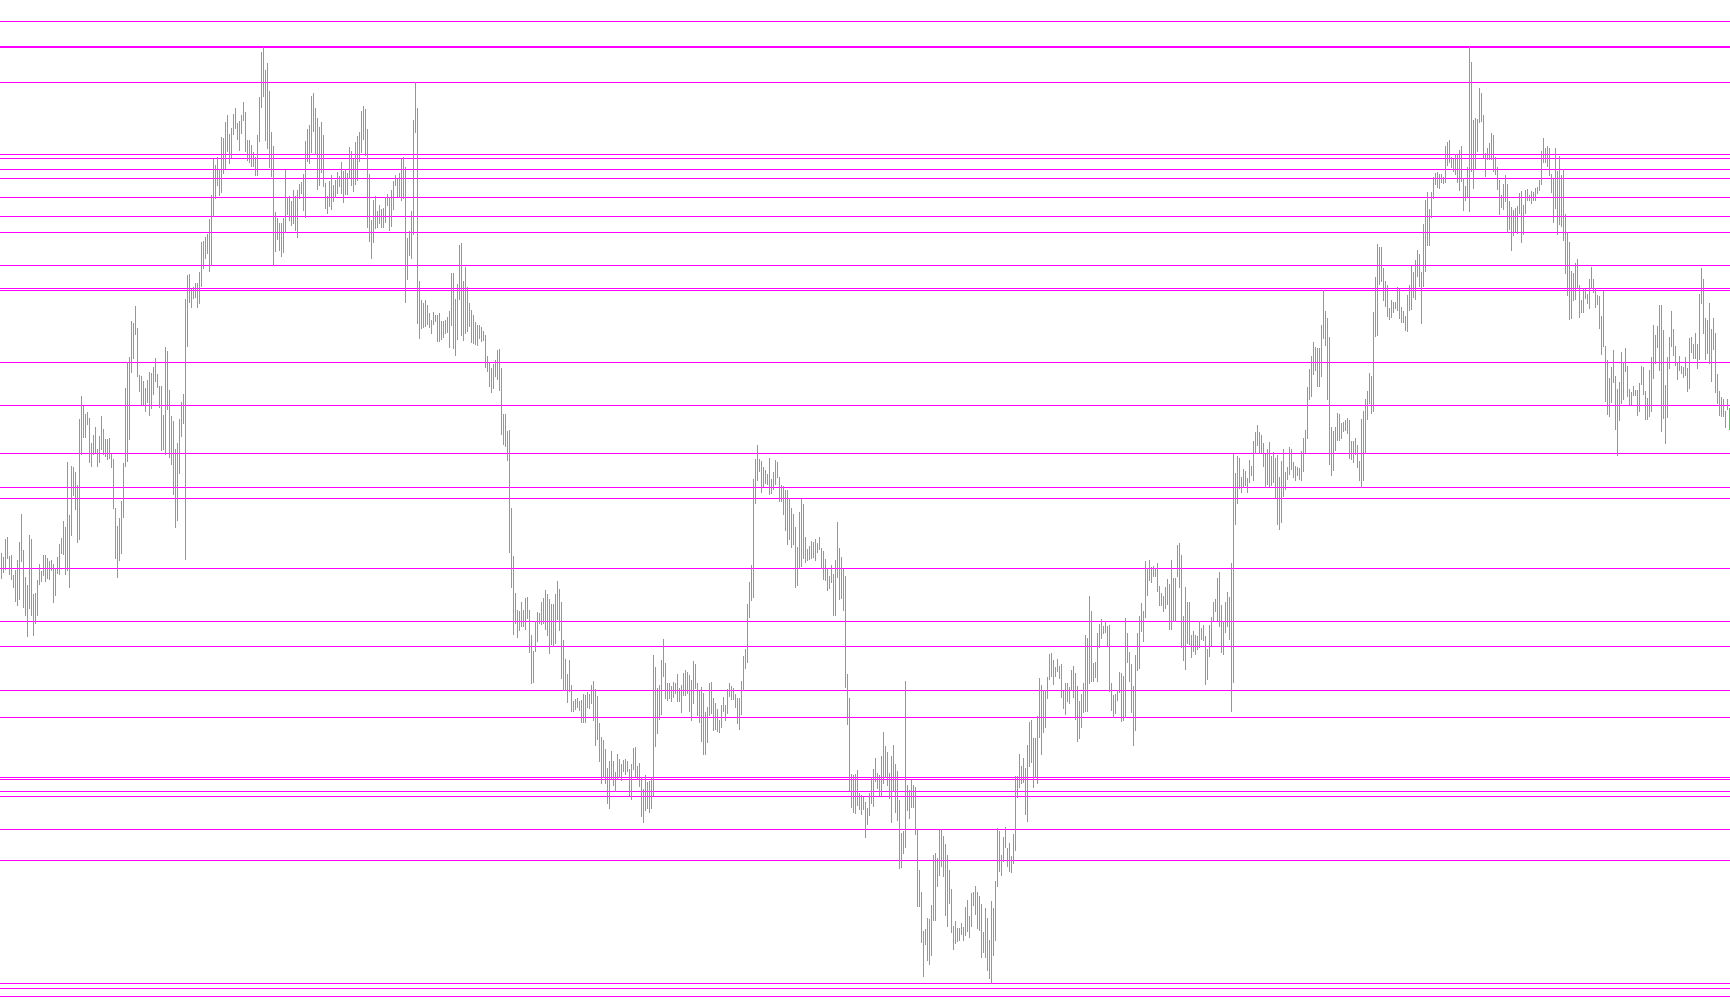
This tool is designed to provide traders with a clear visual representation of historical price milestones directly on their trading charts. By identifying and projecting specific high and low price points from a set period in the past, it helps users visualize significant "levels" that may act as areas of interest for future market movement.
How the Logic Works
The script functions by scanning back through a substantial amount of historical data to pinpoint 300 individual high and low price points. Instead of just showing these as static dots in the past, the tool converts this data into dynamic horizontal lines on your current chart.
Key behaviors include:
- Historical Data Retrieval: The tool looks deep into the market history (specifically targeting a range of 43,200 units) to capture a wide array of previous price peaks and valleys.
- Dynamic Line Projection: For every high and low point identified, the script draws a visual line. It connects the historical point to a projected area in the future. This allows you to see where past price extremes "extend" into current market territory.
- Real-Time Updating: The tool is built to stay current. As new candles form and time moves forward, the lines automatically adjust their positions to ensure they remain aligned with the latest data and your current chart view.
- Customizable Visualization: Users can easily modify how these levels appear—such as changing the color, thickness, and style of the lines, or choosing whether the lines should extend infinitely (rays) across the screen.
- Automatic Cleanup: To keep your trading workspace organized, the script includes a "deinitialization" process. This ensures that when you remove the tool from your chart, all 600 generated lines are automatically deleted, leaving your chart clean and clutter-free.
Summary for the Trader
Essentially, this tool acts as a visual map of historical price boundaries. By projecting these past highs and lows onto your current screen, it helps you identify potential support and resistance zones more effectively, making it easier to spot where the market might react based on previous price action.
//+------------------------------------------------------------------+
//|                                                    JS.Levels.mq4 |
//|     Trading systems developer, contact js_sergey@list.ru  © 2009 |
//+------------------------------------------------------------------+
#property copyright " js_sergey@list.ru "
#property link      " http://multiexperts.ru/ "

#property indicator_chart_window

extern int   style  = 0;
extern int   width = 1;
extern bool  ray    = True;
extern color color1   = Magenta;

string lineLow[300];
string lineHigh[300];
double dLow[300];
double dHigh[300];
//+------------------------------------------------------------------+
int start()
  {
//----
   for (int i=0; i<300; i++) {

    dLow[i] = iLow(Symbol(),43200,i);
    dHigh[i] = iHigh(Symbol(),43200,i);

    datetime Ts = Time[0]+Period()*40*(WindowBarsPerChart());

    lineLow[i] = "Level.Low = "+i;
    lineHigh[i]= "Level.High = "+i;

    if(ObjectFind(lineLow[i])!=0)
    ObjectDelete(lineLow[i]);
    if(ObjectFind(lineLow[i])<0){
    ObjectCreate(lineLow[i], OBJ_TREND, 0, Ts, dLow[i], Time[10],dLow[i]);
    ObjectSet(lineLow[i], OBJPROP_STYLE, style);
    ObjectSet(lineLow[i], OBJPROP_WIDTH, width);
    ObjectSet(lineLow[i], OBJPROP_COLOR, color1);
    ObjectSet(lineLow[i], OBJPROP_BACK,  true);
    ObjectSet(lineLow[i], OBJPROP_RAY,   ray); // ray
   } else {
      ObjectMove(lineLow[i], 1, Time[10],dLow[i]);
      ObjectMove(lineLow[i], 0, Ts,dLow[i]);
   }


    if(ObjectFind(lineHigh[i])!=0)
    ObjectDelete(lineHigh[i]);
    if(ObjectFind(lineHigh[i])<0){
    ObjectCreate(lineHigh[i], OBJ_TREND, 0, Ts, dHigh[i], Time[10],dHigh[i]);
    ObjectSet(lineHigh[i], OBJPROP_STYLE, style);
    ObjectSet(lineHigh[i], OBJPROP_WIDTH, width);
    ObjectSet(lineHigh[i], OBJPROP_COLOR, color1);
    ObjectSet(lineHigh[i], OBJPROP_BACK,  true);
    ObjectSet(lineHigh[i], OBJPROP_RAY,   ray); // ray
   } else {
      ObjectMove(lineHigh[i], 1,Time[10],dHigh[i]);
      ObjectMove(lineHigh[i], 0,Ts,dHigh[i]);
   }
 }
//----
   return(0);
}
//+------------------------------------------------------------------+
int deinit()
  {
  //----
    for (int i=0; i<300; i++) {

    lineLow[i] = "Level.Low = "+i;
    lineHigh[i]= "Level.High = "+i;

    ObjectDelete(lineLow[i]);
    ObjectDelete(lineHigh[i]);
   }
//----
   return(0);
  }
//+------------------------------------------------------------------+
Comments