K-Barishpoltz Channel Fractals
Download script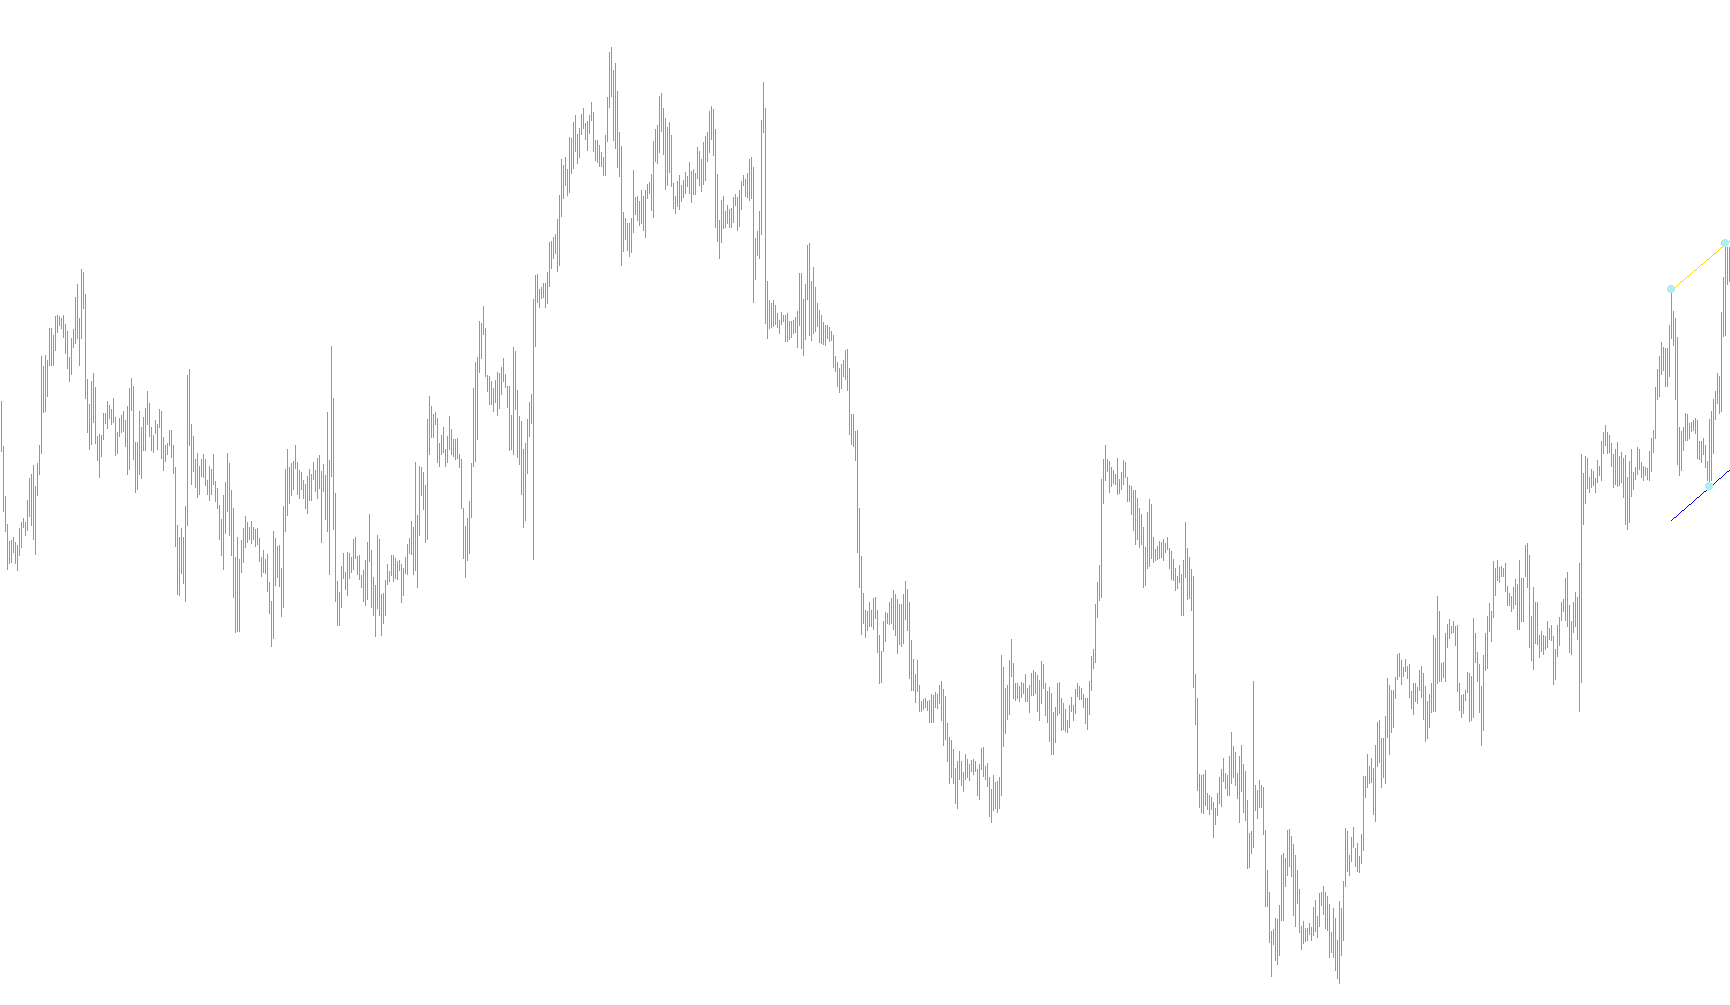
This script is designed to automatically identify and draw geometric "channels" on a price chart. Instead of requiring a trader to manually draw lines to identify trends, the logic works by scanning the historical data for specific structural turning points and connecting them based on mathematical rules.
Core Logical Workflow
1. Identification of Key Turning Points (Fractals) The script begins by scanning the market history to find "peaks" and "valleys." It does this by looking for specific price candles where the high or low point is higher (or lower) than the candles immediately surrounding it. These points are essentially the structural "anchors" of the market's movement.
2. Scanning for Valid Connections Once these peaks and valleys are identified, the script looks for pairs to connect. It doesn't just connect every point it finds; it follows a specific set of rules:
- Distance: It ensures there is a minimum gap between points so that the lines aren't cluttered by minor price fluctuations.
- Sequence: It searches for chronological order to ensure the trend flows correctly from past to present.
- Boundaries (The "Check" System): This is the most critical logic in the script. Before drawing a line, it performs a mathematical check to see if any other price data points "break" the proposed channel. If a price bar moves outside the area that would be enclosed by the new line, the script rejects that connection and continues searching for a valid one.
3. Dynamic Channel Construction When a valid pair of points is found that satisfies all the requirements (correct distance, chronological order, and no boundary violations), the script calculates the trajectory. It then draws:
- A Top Border: A line defining the upper limit of the price movement.
- A Bottom Border: A line defining the lower limit.
- Structural Markers: Specific icons or labels to highlight the exact peaks and valleys used to build that specific channel.
Summary for the User
In essence, this tool automates the "trend-line" drawing process. It acts like a smart architect: it looks at the history of the market, finds the most significant structural high and low points, checks if connecting them creates a clean path that isn't interrupted by previous price action, and then automatically plots those boundaries on your chart to help identify the current market corridor.
//+------------------------------------------------------------------+
//|                                          Barishpoltz Channel.mq4 |
//|                                                        SaiborEye |
//|                                                                  |
//+------------------------------------------------------------------+
#property copyright "SaiborEye"
#property link      ""
 /*
Âàðèàíò èíäèêàòîðà, èñïîëüçóþùåãî ôðàêòàëû  ïðè  ïîñòðîåíèè  è  îòîáðàæåíèå
ñêîëüçÿùèõ    êàíàëîâ    Áàðèøïîëüöà.     Äàííûé     ðåëèç     ïðåäíàçíà÷åí
äëÿ ïðèêëàäíîé îöåíêè âîçìîæíîñòè îòêàçà îò ðó÷íîãî ïîñòðîåíèÿ, âûÿâëåíèÿ è
êîððåêöèè ñëàáûõ ìåñò,  ïðåäëîæåíèÿ  ïî  ââîäó  äîïîëíèòåëüíûõ   ïàðàìåòðîâ
 */
#property indicator_chart_window
#property indicator_buffers 3
#property indicator_color1 Gold
#property indicator_color2 Coral
#property indicator_color3 Aquamarine
//---- input parameters
extern int       RightLevel=3;//    Îòñòóï îò ïðàâîé ãðàíèöû ãðàôèêà (Íîìåð áàðà, 0 - ïîñëåäíèé, íå ñôîðìèðîâàâøèéñÿ)
extern int       BetweenPeaks=2;//  Ìèíèìàëüíîå ðàññòîÿíèå ìåæäó ýêñòðåìóìàìè (êîëè÷åñòâî áàðîâ)
extern int       MaxLength=600;//   Ìàêñèìàëüíàÿ ðàçðåøåííàÿ äëèíà êàíàëà (êîëè÷åñòâî áàðîâ)

//---- buffers
double ExtMapBuffer1[];
double ExtMapBuffer2[];
double ExtMapBuffer3[];
//+------------------------------------------------------------------+
//| Custom indicator initialization function                         |
//+------------------------------------------------------------------+
int init()
  {
//---- indicators
   SetIndexStyle(0,DRAW_SECTION);
   SetIndexBuffer(0,ExtMapBuffer1);
   SetIndexEmptyValue(0,0.0);
   SetIndexLabel(0,"Top Border");
   SetIndexStyle(1,DRAW_SECTION);
   SetIndexBuffer(1,ExtMapBuffer2);
   SetIndexEmptyValue(1,0.0);
   SetIndexLabel(1,"Bottom Border");
   SetIndexStyle(2,DRAW_ARROW,STYLE_SOLID,3);
   SetIndexBuffer(2,ExtMapBuffer3);
   SetIndexEmptyValue(2,0.0);
   SetIndexArrow(2,159);
   SetIndexLabel(2,"Fractal");
//----

   return(0);
  }
//+------------------------------------------------------------------+
//| Custom indicator deinitialization function                       |
//+------------------------------------------------------------------+
int deinit()
  {
//----

//----
   return(0);
  }
//+------------------------------------------------------------------+
int CheckBorders(int X1,int X2,int X3,double Y1,double Y2,double Y3,bool TwoTop){
int x,limit;
   if(X1>X2)limit=X1;else limit=X2;
   if(TwoTop){// TOP TWO
   for(x=RightLevel;x<limit;x++){// LINE LOOP-1
   if(Y2+(x*1.0-X2*1.0)*(Y1-Y2)/(X1*1.0-X2*1.0)<High[x])return (1);
   }// LINE LOOP-1
   for(x=RightLevel;x<limit;x++){// LINE LOOP-2
    if(Y3+(x*1.0-X3*1.0)*(Y1-Y2)/(X1*1.0-X2*1.0)>Low[x])return (-1);
   }// LINE LOOP-2
   return (0);
   }// TOP TWO
   if(!TwoTop){// BOTTOM TWO
   for(x=RightLevel;x<limit;x++){// LINE LOOP-3
   if(Y2+(x*1.0-X2*1.0)*(Y1-Y2)/(X1*1.0-X2*1.0)>Low[x])return (-1);
   }// LINE LOOP-3
   for(x=RightLevel;x<limit;x++){// LINE LOOP-4
    if(Y3+(x*1.0-X3*1.0)*(Y1-Y2)/(X1*1.0-X2*1.0)<High[x])return (1);
   }// LINE LOOP-4
   return (0);
   }// BOTTOM TWO
   return (-1);}
//+------------------------------------------------------------------+
//| Custom indicator iteration function                              |
//+------------------------------------------------------------------+
int start()
  {
   int PosX1[2],PosX2,pos,pos1,pos2,limit;
   double value;
   bool Flag;
   int TopPeaksPos[];
   int TopPeaksIndex;
   int BottomPeaksPos[];
   int BottomPeaksIndex;
//----
     limit=MaxLength;if(limit>Bars-2)limit=Bars-2;if(RightLevel<2)RightLevel=2;
      ArrayResize(TopPeaksPos,limit);ArrayResize(BottomPeaksPos,limit);
     TopPeaksIndex=0;BottomPeaksIndex=0;
      ArrayInitialize(ExtMapBuffer1,0.0);ArrayInitialize(ExtMapBuffer2,0.0);ArrayInitialize(ExtMapBuffer3,0.0);
//----
   for(pos=RightLevel;pos<limit;pos++){// MAIN SEEK LOOP
   if(High[pos]>High[pos-1]&&High[pos]>High[pos-2])
   if(High[pos]>High[pos+1]&&High[pos]>High[pos+2]){TopPeaksPos[TopPeaksIndex]=pos;TopPeaksIndex++;}
   if(Low[pos]<Low[pos-1]&&Low[pos]<Low[pos-2])
   if(Low[pos]<Low[pos+1]&&Low[pos]<Low[pos+2]){BottomPeaksPos[BottomPeaksIndex]=pos;BottomPeaksIndex++;}
      }// MAIN SEEK LOOP
//----
     if(BottomPeaksIndex<TopPeaksIndex)limit=BottomPeaksIndex;else limit=TopPeaksIndex;
     for(pos=0;pos<limit;pos++){// SEEK LOOP
     if(TopPeaksPos[pos]<BottomPeaksPos[pos]){// TOP NEARLY
     for(pos1=pos;pos1<TopPeaksIndex;pos1++){// SECOND POINT SEEK
     for(pos2=0;pos2<BottomPeaksIndex;pos2++)if(BottomPeaksPos[pos2]<=TopPeaksPos[pos1])if(BottomPeaksPos[pos2]>=TopPeaksPos[pos])
     if(TopPeaksPos[pos1]-TopPeaksPos[pos]>BetweenPeaks)if(CheckBorders(TopPeaksPos[pos],TopPeaksPos[pos1],BottomPeaksPos[pos2],
     High[TopPeaksPos[pos]],High[TopPeaksPos[pos1]],Low[BottomPeaksPos[pos2]],TRUE)==0){// DRAWING
   ExtMapBuffer1[0] = (0-TopPeaksPos[pos])*(High[TopPeaksPos[pos1]]-High[TopPeaksPos[pos]])/(TopPeaksPos[pos1]-TopPeaksPos[pos])+High[TopPeaksPos[pos]];
   ExtMapBuffer1[TopPeaksPos[pos1]] = High[TopPeaksPos[pos1]];
   ExtMapBuffer2[0] = Low[BottomPeaksPos[pos2]]+(0-BottomPeaksPos[pos2])*
      (High[TopPeaksPos[pos1]]-High[TopPeaksPos[pos]])/(TopPeaksPos[pos1]-TopPeaksPos[pos]);
   ExtMapBuffer2[TopPeaksPos[pos1]] = Low[BottomPeaksPos[pos2]]+(TopPeaksPos[pos1]-BottomPeaksPos[pos2])*
      (High[TopPeaksPos[pos1]]-High[TopPeaksPos[pos]])/(TopPeaksPos[pos1]-TopPeaksPos[pos]);
   ExtMapBuffer3[TopPeaksPos[pos]]=High[TopPeaksPos[pos]];ExtMapBuffer3[TopPeaksPos[pos1]]=High[TopPeaksPos[pos1]];
   ExtMapBuffer3[BottomPeaksPos[pos2]]=Low[BottomPeaksPos[pos2]];
   return (0);
      }// DRAWING
         }// SECOND POINT SEEK
     }else {// BOTTOM NEARLY
     for(pos1=pos;pos1<BottomPeaksIndex;pos1++){// SECOND POINT SEEK
     for(pos2=0;pos2<TopPeaksIndex;pos2++)if(TopPeaksPos[pos2]<=BottomPeaksPos[pos1])if(TopPeaksPos[pos2]>=BottomPeaksPos[pos])
     if(BottomPeaksPos[pos1]-BottomPeaksPos[pos]>BetweenPeaks)if(CheckBorders(BottomPeaksPos[pos],BottomPeaksPos[pos1],TopPeaksPos[pos2],
     Low[BottomPeaksPos[pos]],Low[BottomPeaksPos[pos1]],High[TopPeaksPos[pos2]],FALSE)==0){// DRAWING
   ExtMapBuffer1[0] = (0-BottomPeaksPos[pos])*(Low[BottomPeaksPos[pos1]]-Low[BottomPeaksPos[pos]])/(BottomPeaksPos[pos1]-BottomPeaksPos[pos])+Low[BottomPeaksPos[pos]];
   ExtMapBuffer1[BottomPeaksPos[pos1]] = Low[BottomPeaksPos[pos1]];
   ExtMapBuffer2[0] = High[TopPeaksPos[pos2]]+(0-TopPeaksPos[pos2])*
      (Low[BottomPeaksPos[pos1]]-Low[BottomPeaksPos[pos]])/(BottomPeaksPos[pos1]-BottomPeaksPos[pos]);
   ExtMapBuffer2[BottomPeaksPos[pos1]] = High[TopPeaksPos[pos2]]+(BottomPeaksPos[pos1]-TopPeaksPos[pos2])*
      (Low[BottomPeaksPos[pos1]]-Low[BottomPeaksPos[pos]])/(BottomPeaksPos[pos1]-BottomPeaksPos[pos]);
   ExtMapBuffer3[BottomPeaksPos[pos]]=Low[BottomPeaksPos[pos]];ExtMapBuffer3[BottomPeaksPos[pos1]]=Low[BottomPeaksPos[pos1]];
   ExtMapBuffer3[TopPeaksPos[pos2]]=High[TopPeaksPos[pos2]];
   return (0);
      }// DRAWING
            }// SECOND POINT SEEK
         }// BOTTOM NEARLY
     }// SEEK LOOP
   return(0);
  }
//+------------------------------------------------------------------+
Comments