Kase CD Peak
Download script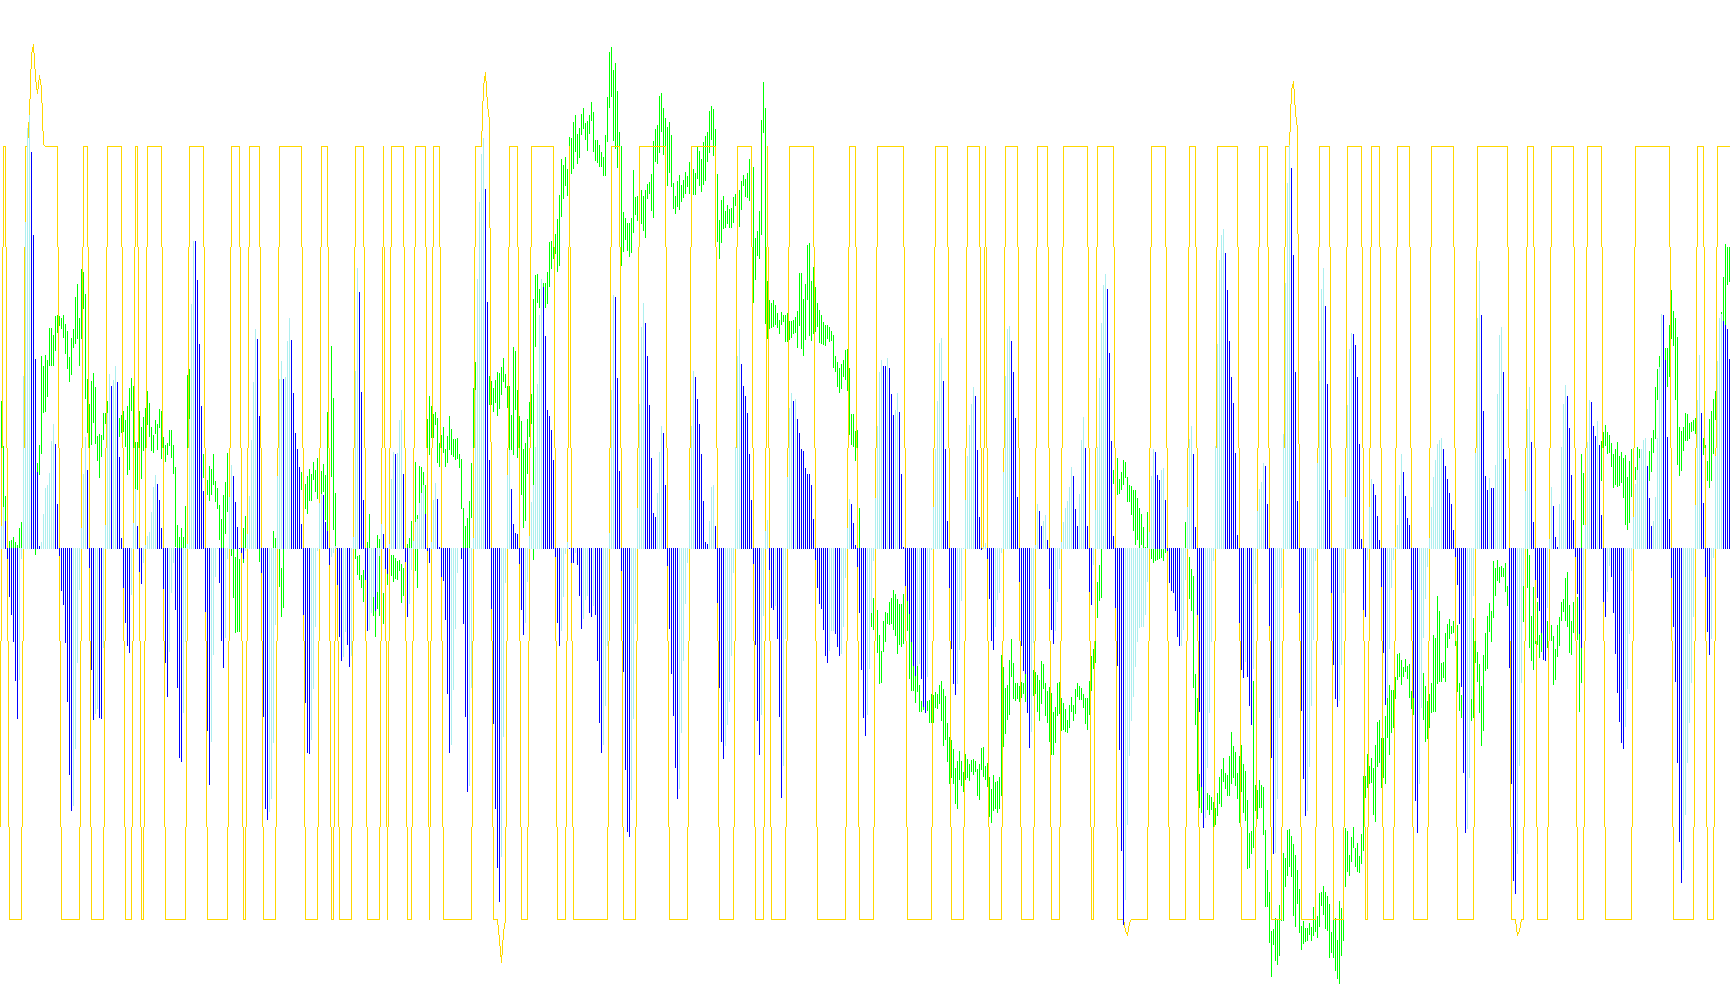
The Kase CD Peak is a specialized technical analysis tool designed to smooth out market noise and identify the underlying momentum of price movements. It works by analyzing how price fluctuates over specific intervals and transforming those fluctuations into a visual representation of "trend strength" and "momentum direction."
Here is a breakdown of the logic used by this script:
1. Relative Movement Analysis
The tool begins by looking at the relationship between the current high and low prices compared to the highs and lows of a previous period. It calculates how much the price has moved relative to its average volatility (the "Average True Range"). By subtracting these two movements from each other, the script determines if the market is leaning more toward a bullish movement or a bearish movement relative to its recent history.
2. Smoothing and Stabilization
Raw market data is often jagged and erratic. To make the data usable for human observation, the script applies multiple layers of mathematical smoothing (moving averages). This process removes "market noise"—the small, meaningless price wiggles—leaving behind a cleaner line that represents the primary trend. It essentially filters out the distractions so you can see the broader path the market is taking.
3. Momentum and Deviation (KCD)
The core of the script calculates what it calls the "KCD" value. This represents the difference between the current smoothed momentum and a longer-term average of that same momentum.
- When this value is positive, it indicates upward pressure.
- When it is negative, it indicates downward pressure.
4. Dynamic Thresholds and Signal Generation
The script doesn't just show you the raw KCD value; it evaluates it against statistical "standard deviations." It calculates a dynamic ceiling and floor for the data.
- Trend Strength: It looks for instances where the momentum exceeds specific mathematical boundaries. If the momentum is strong enough to break through these calculated thresholds, the script highlights it as a significant trend signal (represented by the Gold line).
- Directional Histogram: Finally, the script produces a visual histogram that changes color based on whether the current momentum is increasing or decreasing. This provides a quick visual cue:
- One color identifies when the momentum is "fading" or dropping.
- The other color identifies when the momentum is "strengthening" or rising.
Summary of Visual Output
- The Gold Line: Represents the filtered, high-confidence trend strength, bounded by statistical limits to ensure only significant movements are highlighted.
- The Histograms (Red/Lime): Provide a real-time visual pulse of the momentum, showing you at a glance whether the current move is gaining speed or losing steam.
//+------------------------------------------------------------------+
//|                                                 Kase CD Peak.mq4 |
//|                                                 Copyright © 2006 |
//|                                        http://www.stupidlife.org |
//|                                              gexabox.@.mail...ru |
//+------------------------------------------------------------------+
/*
RWH:=(H-Ref(L,-Per1))/(ATR(Per1)*Sqrt(Per1));
RWL:=(Ref(H,-Per1)-L)/(ATR(Per1)*Sqrt(Per1));
Pk:= Mov(Mov((RWH-RWL),3,W),3,S);
KCD:= PK-Mov(PK,8,S);
MN:= Mov(KCD,Per1,S);
SD:= Stdev(KCD,Per1);
Val1:= If(MN+(1.33*SD)>2.08,MN+(1.33*SD),2.08);
Val2:= If(MN-(1.33*SD)<-1.92,MN-(1.33*SD),-1.92);
LN:= If(Ref(KCD,-1)>=0 AND KCD>0,Val1,If(Ref(KCD,-1)<=0 AND KCD<0,Val2,0));
Red:= If(Ref(KCD,-1)>KCD,KCD,0);
Green:= If(KCD>Ref(KCD,-1),KCD,0);
*/
#property copyright "Copyright © 2006"
#property link      "http://www.stupidlife.org"

#property indicator_separate_window
#property indicator_buffers 3
#property indicator_color1 Gold
#property indicator_color2 Red
#property indicator_color3 Lime

//---- input parameters
extern int       Periods=8;
//---- buffers
double LN[];
double RedHist[];
double GreenHist[];

double RWArr[];
double PrePk[];
double Pk[];
double KCD[];

double SqrtPer;

//+------------------------------------------------------------------+
//| Custom indicator initialization function                         |
//+------------------------------------------------------------------+
int init()
  {
//---- 2 additional buffers are used for counting.
   IndicatorBuffers(7);
//---- name for DataWindow and indicator subwindow label
   IndicatorShortName("KaseCD("+Periods+")");
//---- indicators
   SetIndexStyle(0,DRAW_LINE);
   SetIndexBuffer(0,LN);
   SetIndexStyle(1,DRAW_HISTOGRAM);
   SetIndexBuffer(1,RedHist);
   SetIndexStyle(2,DRAW_HISTOGRAM);//DRAW_NONE
   SetIndexBuffer(2,GreenHist);
//----
   SetIndexBuffer(3,RWArr);
   SetIndexBuffer(4,PrePk);
   SetIndexBuffer(5,Pk);
   SetIndexBuffer(6,KCD);

   SetIndexDrawBegin(0,Periods+3+3+8+Periods);
   SetIndexDrawBegin(1,Periods+3+3+8+Periods);
   SetIndexDrawBegin(2,Periods+3+3+8+Periods);

   SqrtPer = MathSqrt(Periods);

   return(0);
  }

//+------------------------------------------------------------------+
//| Custom indicator iteration function                              |
//+------------------------------------------------------------------+
int start()
  {
   double rwh = 0;
   double rwl = 0;
   double mn = 0;
   double sd = 0;
   double val1 = 0;
   double val2 = 0;
   double atr = 0;
   int i;
   int    counted_bars=IndicatorCounted();
   //unted_bars = Bars - 100;
   if(counted_bars<0) return(-1);
   //---- last counted bar will be recounted
   if(counted_bars>0) counted_bars--;
   if(counted_bars>=Periods+3+3+8+Periods) counted_bars-=(Periods+3+3+8+Periods);
   if(counted_bars==0) {
      for(i=(Bars-1); i>=(Bars-1)-counted_bars-Periods-3-3-8-Periods+1; i--) {
         RWArr[i] = 0;
         PrePk[i] = 0;
         Pk[i] = 0;
         KCD[i] = 0;
         LN[i] = 0;
         RedHist[i] = 0;
         GreenHist[i] = 0;
      }
   }
// RWH:=(H-Ref(L,-Per1))/(ATR(Per1)*Sqrt(Per1));
// RWL:=(Ref(H,-Per1)-L)/(ATR(Per1)*Sqrt(Per1));
   for(i=(Bars-1)-counted_bars-Periods; i>=0; i--)
   {
      rwh = 0; rwl = 0;
      atr = iATR(NULL, 0, Periods,i)*SqrtPer;
      if(atr!=0){
         rwh = (High[i]-Low[i+Periods])/atr;
         rwl = (High[i+Periods]-Low[i])/atr;
      }
      RWArr[i] = rwh - rwl;
   }
// Pk:= Mov(Mov((RWH-RWL),3,W),3,S);
   for(i=(Bars-1)-counted_bars-Periods-3; i>=0; i--)
   {
      PrePk[i] = iMAOnArray(RWArr,Bars,3,0,MODE_LWMA,i);
   }
   for(i=(Bars-1)-counted_bars-Periods-3-3; i>=0; i--)
   {
      Pk[i] = iMAOnArray(PrePk,Bars,3,0,MODE_SMA,i);
   }
// KCD:= PK-Mov(PK,8,S);
   for(i=(Bars-1)-counted_bars-Periods-3-3-8; i>=0; i--)
   {
      KCD[i] = Pk[i]-iMAOnArray(Pk,Bars,8,0,MODE_SMA,i);
   }
   for(i=(Bars-1)-counted_bars-Periods-3-3-8-Periods; i>=0; i--)
   {
//    MN:= Mov(KCD,Per1,S);
//    SD:= Stdev(KCD,Per1);
      mn = iMAOnArray(KCD,Bars,Periods,0,MODE_SMA,i);
      sd = iStdDevOnArray(KCD,Bars,Periods,0,MODE_SMA,i);

//    Val1:= If(MN+(1.33*SD)>2.08,MN+(1.33*SD),2.08);
      if(mn+(1.33*sd)>2.08)
         val1 = mn+(1.33*sd);
      else
         val1 = 2.08;
//    Val2:= If(MN-(1.33*SD)<-1.92,MN-(1.33*SD),-1.92);
      if(mn-(1.33*sd)<-1.92)
         val2 = mn-(1.33*sd);
      else
         val2 = -1.92;

//    LN:= If(Ref(KCD,-1)>=0 AND KCD>0,Val1,If(Ref(KCD,-1)<=0 AND KCD<0,Val2,0));
      if(KCD[i+1]>=0 && KCD[i]>0)
         LN[i] = val1;
      else
         if(KCD[i+1]<=0 && KCD[i]<0)
            LN[i] = val2;
         else
            LN[i] = 0;

//    Red:= If(Ref(KCD,-1)>KCD,KCD,0);
      if(KCD[i+1]>KCD[i])
         RedHist[i] = KCD[i];
      else
         RedHist[i] = 0;

//    Green:= If(KCD>Ref(KCD,-1),KCD,0);
      if(KCD[i]>KCD[i+1])
         GreenHist[i] = KCD[i];
      else
         GreenHist[i] = 0;
   }

   return(0);
  }
//+------------------------------------------------------------------+
Comments