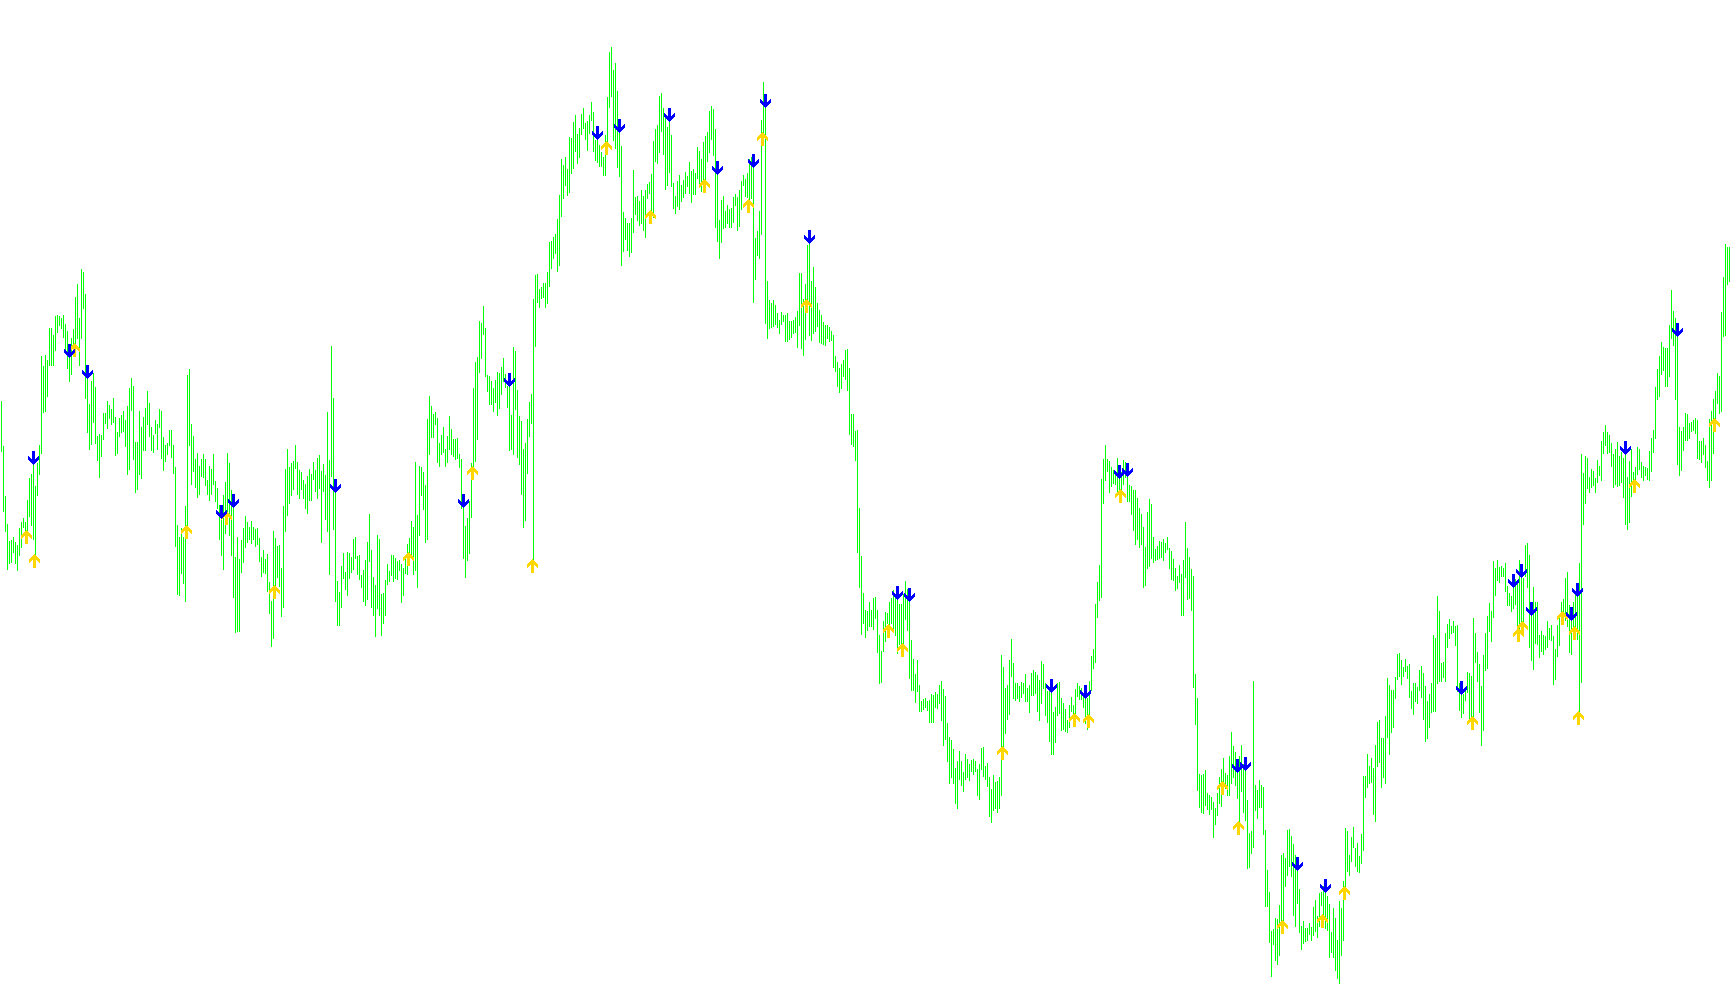
This tool is designed as a visual aid for traders to identify specific momentum shifts in the market by monitoring the interaction between two different types of moving averages. Rather than simply showing price trends, it highlights "crossovers"—the exact moments when one mathematical trend line passes through another.
Core Methodology
The script functions by comparing two distinct indicators simultaneously:
- The Kaufman Adaptive Moving Average (Kaufman): This is a sophisticated indicator that adjusts its sensitivity based on market noise. It helps smooth out price "flickers" while remaining responsive to significant trend changes.
- The Linear Weighted Moving Average (WMA): This is a standard momentum indicator that gives more weight to recent price data, making it highly reactive to current market activity.
How the Logic Works
The script constantly scans the price history to detect when these two lines intersect. It looks for two specific types of movements:
- Upside Crosses: When the Kaufman indicator moves from being below the WMA to appearing above it, the script identifies this as a potential upward momentum shift. It places a blue visual marker below the candle at this point and triggers an alert.
- Downside Crosses: Conversely, when the Kaufman indicator moves from above the WMA to falling below it, the script recognizes this as a potential downward momentum shift. It places a red visual marker above the candle and triggers a corresponding alert.
Dynamic Adjustments
To ensure the tool remains useful across different types of charts (such as 1-minute vs. 4-hour timeframes), the script includes an automated "shift" logic. This adjusts the distance between the visual markers and the price candles based on the specific timeframe being viewed, preventing the signals from overlapping with the price bars and ensuring clear visibility for the user.
User Experience
The primary goal of this logic is to filter out market noise and provide clear, actionable signals. By using both an adaptive average and a weighted average, the tool aims to confirm trend changes more reliably than using a single indicator alone. When a significant crossover occurs, the trader receives both a visual cue on the chart and a real-time notification alert.
//+------------------------------------------------------------------+
//|                                                 KaufWMAcross.mq4 |
//|                      Copyright © 2007, MetaQuotes Software Corp. |
//|                                        http://www.metaquotes.net |
//+------------------------------------------------------------------+
#property copyright "Copyright © 2007, MetaQuotes Software Corp."
#property link "http://www.metaquotes.net"
//----
#property indicator_chart_window
#property indicator_buffers 2
#property indicator_color1 Blue
#property indicator_color2 Red
//---- input parameters
extern int KaufPeriod=9;
extern int WMAPeriod=5;
//---- buffers
double ExtMapBuffer1[];
double ExtMapBuffer2[];
//----
double kf0,kf1,wma0,wma1;
int    nShift;
datetime Newbar;
bool Alerts_on= true;
//+------------------------------------------------------------------+
//| Custom indicator initialization function                         |
//+------------------------------------------------------------------+
int init()
  {
//---- indicators
   SetIndexStyle(0, DRAW_ARROW, 0, 1);
   SetIndexArrow(0, 233);
   SetIndexBuffer(0, ExtMapBuffer1);
//----
   SetIndexStyle(1, DRAW_ARROW, 0, 1);
   SetIndexArrow(1, 234);
   SetIndexBuffer(1, ExtMapBuffer2);
//---- name for DataWindow and indicator subwindow label
   IndicatorShortName("KaufWMAcrosses("+KaufPeriod+","+WMAPeriod);
   SetIndexLabel(0, "CrossUp");
   SetIndexLabel(1, "CrossDn");
//----
   switch(Period())
     {
      case     1: nShift=1;   break;
      case     5: nShift=3;   break;
      case    15: nShift=5;   break;
      case    30: nShift=10;  break;
      case    60: nShift=15;  break;
      case   240: nShift=20;  break;
      case  1440: nShift=80;  break;
      case 10080: nShift=100; break;
      case 43200: nShift=200; break;
     }
//----
   return(0);
  }
//+------------------------------------------------------------------+
//| Custor indicator deinitialization function                       |
//+------------------------------------------------------------------+
int deinit()
  {
//----
   return(0);
  }
//+------------------------------------------------------------------+
//| Custom indicator iteration function                              |
//+------------------------------------------------------------------+
int start()
  {
   int limit;
   int counted_bars=IndicatorCounted();
//---- check for possible errors
   if(counted_bars < 0)
      return(-1);
//---- last counted bar will be recounted
   if(counted_bars > 0)
      counted_bars--;
   limit=Bars - counted_bars;
//----
   for(int i=0; i < limit; i++)
     {
      kf1=iCustom(NULL, 0,"Kaufman",KaufPeriod,2,30,2, 0, i + 1);
      kf0=iCustom(NULL, 0,"Kaufman",KaufPeriod,2,30,2, 0, i);
      wma1=iMA(NULL, 0, WMAPeriod, 0,MODE_LWMA,PRICE_CLOSE, i + 1);
      wma0=iMA(NULL, 0, WMAPeriod, 0,MODE_LWMA,PRICE_CLOSE, i );
      //----
      if(kf1 > wma1 && kf0 < wma0)
        { ExtMapBuffer1[i]=Low[i] - nShift*Point;
         if(Alerts_on && Newbar!=Time[0])
           Alert("WMA crossed KaufamnMA to the Upside in the "+Period()+" minute "+Symbol()+" chart");}
      //----
      if(kf1 < wma1 && kf0 > wma0)
        {ExtMapBuffer2[i]=High[i] + nShift*Point;
         if(Alerts_on && Newbar!=Time[0])
           Alert("WMA crossed KaufamnMA to the Downside in the "+Period()+" minute "+Symbol()+" chart");}
      Newbar=Time[0];
     }
//----
   return(0);
  }
//+------------------------------------------------------------------+
Comments