Keltner_Chanel
Download script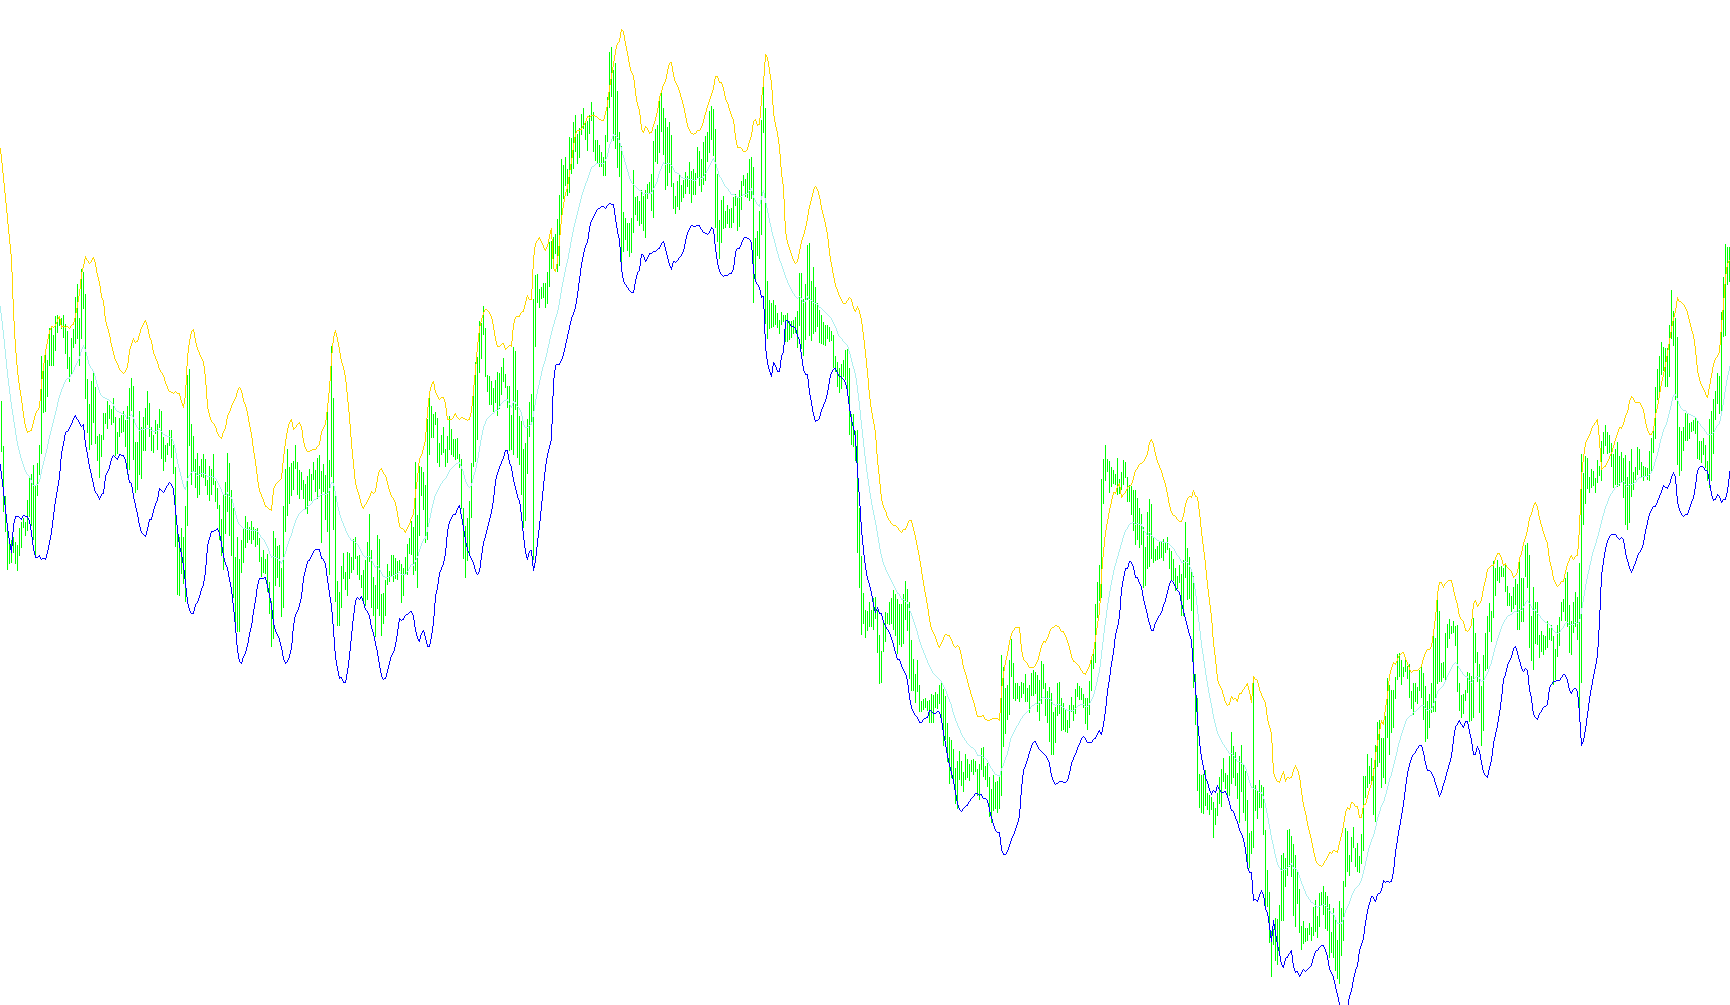
This technical indicator is designed to provide a visual framework for identifying market trends and potential price boundaries on a trading chart. It functions by combining two primary types of mathematical data: a moving average of current prices and a measure of historical volatility.
Core Components of the Logic
The script generates three distinct lines on your chart to help you visualize the "flow" of the market:
1. The Trend Baseline (Exponential Moving Average) At its heart, the script calculates an Exponential Moving Average (EMA). Unlike a simple average that treats all past data equally, this baseline gives more weight to recent price movements. This allows the indicator to react more quickly to new information while still smoothing out the "noise" of minor price fluctuations. This line represents the "fair value" or the current central trend of the asset.
2. The Volatility Bands (The Channel) To determine how far above or below the price might swing, the script uses a calculation called the Average True Range (ATR). This is a measure of how much an asset typically moves over a specific period of time.
By taking this volatility measurement and multiplying it by a custom "shift" factor, the script creates two dynamic boundaries:
- Upper Boundary: The Trend Baseline plus the volatility amount.
- Lower Boundary: The Trend Baseline minus the volatility amount.
How It Works Together
Instead of using static lines (like fixed support or resistance levels), this indicator creates a "dynamic channel" that expands and contracts based on market conditions:
- During High Volatility: When the market becomes jumpy or aggressive, the distance between the upper and lower lines widens automatically to accommodate the larger price swings.
- During Low Volatility: When the market is calm or consolidating, the channel narrows, hugging the trend line more closely.
Practical Application
For a trader, this logic provides a visual representation of "normal" price behavior. By observing where the price sits in relation to these three lines, you can identify whether the market is trending strongly, pulling back toward its average, or potentially overextending beyond its usual volatility limits.
//+------------------------------------------------------------------+
//|                                                Keltner Chanel.mq4 |
//|                                                            Korey |
//|                                                   ekr-ap@mail.ru |
//+------------------------------------------------------------------+
#property copyright "AP"
#property link      "ekr-ap@mail.ru"

#property indicator_chart_window
#property indicator_buffers 3
#property indicator_color1 Red
#property indicator_color2 Red
#property indicator_color3 Red

extern int periodMA=20; //Basic EMA
extern int periodATR=10;//Average True Range period
extern double kshift=2; //shift Lines Upper & Lower

double b0[],b1[],b2[];

int init()
  {

   SetIndexStyle(0,DRAW_LINE);
   SetIndexBuffer(0,b0);
   SetIndexLabel(0,"Upper"+periodATR+","+DoubleToStr(kshift,1));

   SetIndexStyle(1,DRAW_LINE);
   SetIndexBuffer(1,b1);
   SetIndexLabel(1,"Lower"+periodATR+","+DoubleToStr(kshift,1));

   SetIndexStyle(2,DRAW_LINE);
   SetIndexBuffer(2,b2);
   SetIndexLabel(2,"EMA"+periodMA);
  IndicatorShortName("Keltner_Chanel("+periodMA+","+periodATR+","+DoubleToStr(kshift,1)+")");

   return(0);
  }

int start()
  {
   int    i,limit=Bars-IndicatorCounted();
   double r;

      for(i=0;i<=limit;i++)
         {
      b2[i]=iMA(NULL,0,periodMA,0,MODE_EMA,PRICE_CLOSE,i);
      r=kshift*iATR(NULL,0,periodATR,i);
      b0[i]=b2[i]+r;
      b1[i]=b2[i]-r;
         }

   return(0);
  }
//+------------------------------------------------------------------+
Comments