KLinesM
Download script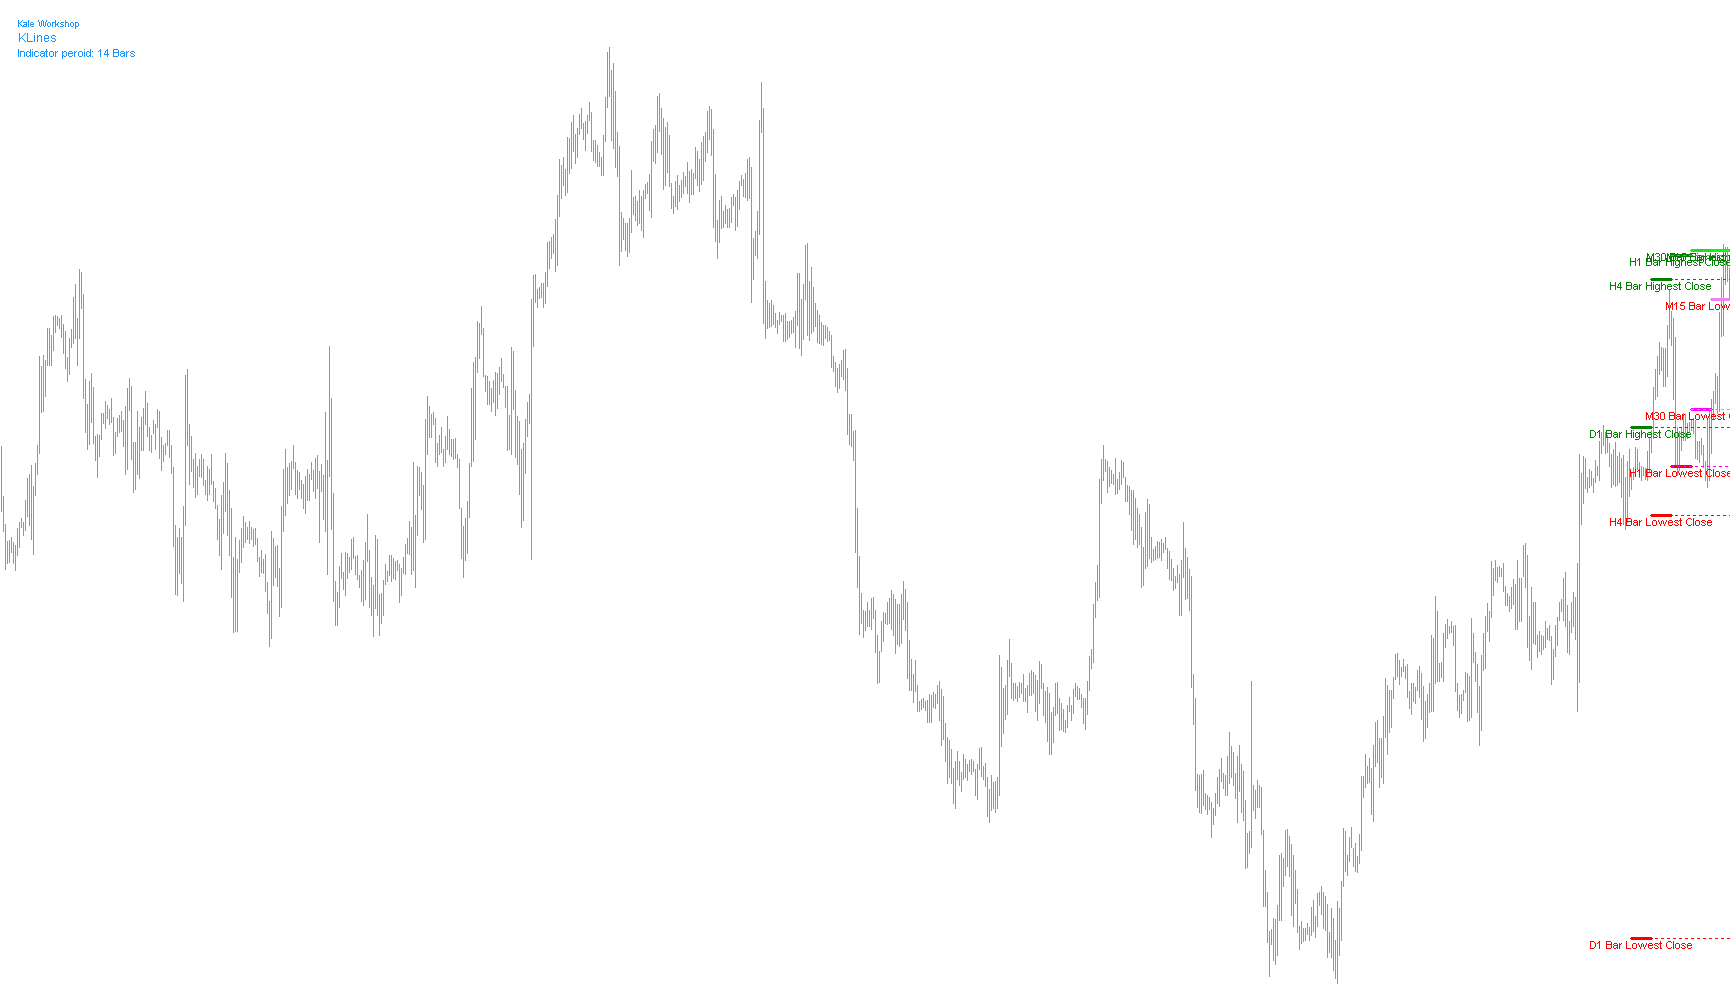
Overview of the KLines Indicator
The KLines indicator is designed to provide traders with a comprehensive visual summary of key price levels across multiple timeframes simultaneously. Instead of requiring you to switch back and forth between different charts (like moving from a 15-minute chart to a Daily chart) to identify significant price boundaries, this tool pulls that data into a single view.
How the Logic Works
The core functionality of the script revolves around identifying two specific types of historical price points: Highest Closes and Lowest Closes.
1. Multi-Timeframe Analysis
The script automatically scans five different timeframes at once:
- Daily (D1)
- 4-Hour (H4)
- 1-Hour (H1)
- 30-Minute (M30)
- 15-Minute (M15)
2. Data Identification
For each of these timeframes, the indicator looks back at a specific number of bars (defined by the user settings) to find:
- The Highest Close: The highest price level reached during the closing of a candle within that period.
- The Lowest Close: The lowest price level reached during the closing of a candle within that period.
3. Visual Representation on the Chart
Once the script identifies these high and low values, it draws them directly on your current chart using specific visual cues:
- Horizontal Reference Lines: It places distinct lines representing these levels. These are organized sequentially across the chart to represent the progression from larger timeframes (Daily) down to smaller ones (15-Minute).
- Color Coding: To help with quick recognition, the indicator uses a color-coded system. Generally, "Highest" levels are associated with shades of Green and Lime, while "Lowest" levels are associated with Red, Magenta, and Violet.
- Line Styles: The script utilizes different line styles (Solid, Dash-Dot, and Dotted) to differentiate between the various timeframes, making it easier to distinguish between a Daily boundary and a 15-Minute boundary at a glance.
- Text Labels: To ensure total clarity, the indicator places text labels next to the lines. These labels explicitly state which timeframe each line belongs to (e.g., "D1 Bar Highest Close"), so there is no ambiguity about what price level you are viewing.
User Experience Summary
For a trader, this means the chart becomes an organized "map" of price action. You can see where the major daily supports and resistances are located alongside the minor 15-minute fluctuations without ever leaving your primary screen. The tool effectively centralizes multi-timeframe data into a clean, readable layout designed for faster decision-making.
//+------------------------------------------------------------------+
//|                                                       KLines.mq4 |
//|                                                          Kalenzo |
//|                                      bartlomiej.gorski@gmail.com |
//+------------------------------------------------------------------+
#property copyright "Kalenzo"
#property link      "bartlomiej.gorski@gmail.com"
//----
extern int KLPeriod=14;
#property indicator_chart_window
//+------------------------------------------------------------------+
//| Custom indicator initialization function                         |
//+------------------------------------------------------------------+
int init()
  {
//---- indicators
   drawLabel();
//----
   return(0);
  }
//+------------------------------------------------------------------+
//| Custom indicator deinitialization function                       |
//+------------------------------------------------------------------+
int deinit()
  {
//----
//   ObjectsDeleteAll() ;

      ObjectDelete("HH_D1");ObjectDelete("HH_H4");ObjectDelete( "HH_H1");
      ObjectDelete("HH_M30");ObjectDelete("HH_M15");ObjectDelete("HH_D1r");
      ObjectDelete("HH_H4r");ObjectDelete("HH_H1r");ObjectDelete("HH_D1r");
      ObjectDelete("HH_H4r");ObjectDelete("HH_M15r");ObjectDelete("HH_M30r");

ObjectDelete("D1 Bar Highest Close");ObjectDelete("H4 Bar Highest Close");
ObjectDelete("H1 Bar Highest Close");ObjectDelete("M30 Bar Highest Close");
ObjectDelete("M15 Bar Highest Close");

      ObjectDelete("LL_D1");ObjectDelete("LL_H4");ObjectDelete( "LL_H1");
      ObjectDelete("LL_M30");ObjectDelete("LL_M15");ObjectDelete("LL_D1r");
      ObjectDelete("LL_H4r");ObjectDelete("LL_H1r");ObjectDelete("LL_D1r");
      ObjectDelete("LL_H4r");ObjectDelete("LL_M15r");ObjectDelete("LL_M30r");

ObjectDelete("D1 Bar Lowest Close");ObjectDelete("H4 Bar Lowest Close");
ObjectDelete("H1 Bar Lowest Close");ObjectDelete("M30 Bar Lowest Close");
ObjectDelete("M15 Bar Lowest Close");

ObjectDelete("KLabelKLines");ObjectDelete("InameKLines");ObjectDelete("DescKLines");


//----
   return(0);
  }
//+------------------------------------------------------------------+
//| Custom indicator iteration function                              |
//+------------------------------------------------------------------+
int start()
  {
//----
   double hhmd =iClose(NULL,PERIOD_D1, Highest (NULL,PERIOD_D1, MODE_CLOSE, KLPeriod,1));
   double hhmh4=iClose(NULL,PERIOD_H4, Highest (NULL,PERIOD_H4, MODE_CLOSE, KLPeriod,1));
   double hhmh1=iClose(NULL,PERIOD_H1, Highest (NULL,PERIOD_H1, MODE_CLOSE, KLPeriod,1));
   double hhm30=iClose(NULL,PERIOD_M30, Highest (NULL,PERIOD_M30, MODE_CLOSE, KLPeriod,1));
   double hhm15=iClose(NULL,PERIOD_M15, Highest (NULL,PERIOD_M15, MODE_CLOSE, KLPeriod,1));
   //
   drawLine("HH_D1",Time[50],Time[40],hhmd,hhmd,3,0,Green,1);
   drawLine("HH_H4",Time[40],Time[30],hhmh4,hhmh4,3,0,Green,1);
   drawLine("HH_H1",Time[30],Time[20],hhmh1,hhmh1,3,0,Green,2);
   drawLine("HH_M30",Time[20],Time[10],hhm30,hhm30,3,0,LimeGreen,2);
   drawLine("HH_M15",Time[10],Time[0],hhm15,hhm15,3,0,Lime,1);
   drawLine("HH_D1r",Time[50],Time[40],hhmd,hhmd,1,1,Green,0);
   drawLine("HH_H4r",Time[40],Time[30],hhmh4,hhmh4,1,1,Green,0);
   drawLine("HH_H1r",Time[30],Time[20],hhmh1,hhmh1,1,1,LimeGreen,0);
   drawLine("HH_M30r",Time[20],Time[10],hhm30,hhm30,1,1,Lime,0);
   //
   drawTXTLabel("D1 Bar Highest Close",hhmd,Time[45],Green);
   drawTXTLabel("H4 Bar Highest Close",hhmh4,Time[35],Green);
   drawTXTLabel("H1 Bar Highest Close",hhmh1,Time[25],Green);
   drawTXTLabel("M30 Bar Highest Close",hhm30,Time[15],Green);
   drawTXTLabel("M15 Bar Highest Close",hhm15,Time[5],Green);
   //
   double llmd =iClose(NULL,PERIOD_D1, Lowest (NULL,PERIOD_D1, MODE_CLOSE, KLPeriod,1));
   double llmh4=iClose(NULL,PERIOD_H4, Lowest (NULL,PERIOD_H4, MODE_CLOSE, KLPeriod,1));
   double llmh1=iClose(NULL,PERIOD_H1, Lowest (NULL,PERIOD_H1, MODE_CLOSE, KLPeriod,1));
   double llm30=iClose(NULL,PERIOD_M30, Lowest (NULL,PERIOD_M30, MODE_CLOSE, KLPeriod,1));
   double llm15=iClose(NULL,PERIOD_M15, Lowest (NULL,PERIOD_M15, MODE_CLOSE, KLPeriod,1));
   //
   drawLine("LL_D1",Time[50],Time[40],llmd,llmd,3,0,Red,1);
   drawLine("LL_H4",Time[40],Time[30],llmh4,llmh4,3,0,Red,1);
   drawLine("LL_H1",Time[30],Time[20],llmh1,llmh1,3,0,Red,2);
   drawLine("LL_M30",Time[20],Time[10],llm30,llm30,3,0,Magenta,2);
   drawLine("LL_M15",Time[10],Time[0],llm15,llm15,3,0,Violet,1);
   drawLine("LL_D1r",Time[50],Time[40],llmd,llmd,1,1,Red,0);
   drawLine("LL_H4r",Time[40],Time[30],llmh4,llmh4,1,1,Red,0);
   drawLine("LL_H1r",Time[30],Time[20],llmh1,llmh1,1,1,Magenta,0);
   drawLine("LL_M30r",Time[20],Time[10],llm30,llm30,1,1,Violet,0);
   //
   drawTXTLabel("D1 Bar Lowest Close",llmd,Time[45],Red);
   drawTXTLabel("H4 Bar Lowest Close",llmh4,Time[35],Red);
   drawTXTLabel("H1 Bar Lowest Close",llmh1,Time[25],Red);
   drawTXTLabel("M30 Bar Lowest Close",llm30,Time[15],Red);
   drawTXTLabel("M15 Bar Lowest Close",llm15,Time[5],Red);
//----
   return(0);
  }
//+------------------------------------------------------------------+
void drawTXTLabel(string name,double lvl,datetime time, color Color)
  {
   if(ObjectFind(name)!=0)
     {
      ObjectCreate(name, OBJ_TEXT, 0, time, lvl);
      ObjectSetText(name, name, 8, "Arial", EMPTY);
      ObjectSet(name, OBJPROP_COLOR, Color);
     }
   else
     {
      ObjectMove(name, 0, time, lvl);
     }
  }
//+------------------------------------------------------------------+
//|                                                                  |
//+------------------------------------------------------------------+
void drawLine(string name,datetime tfrom, datetime tto, double pfrom, double pto, int width, int ray, color Col,int type)
  {
   if(ObjectFind(name)!=0)
     {
      ObjectCreate(name, OBJ_TREND, 0, tfrom, pfrom,tto,pto);
//----
      if(type==1)
         ObjectSet(name, OBJPROP_STYLE, STYLE_SOLID);
      else if(type==2)
            ObjectSet(name, OBJPROP_STYLE, STYLE_DASHDOT);
         else
            ObjectSet(name, OBJPROP_STYLE, STYLE_DOT);
//----
      ObjectSet(name, OBJPROP_COLOR, Col);
      ObjectSet(name,OBJPROP_WIDTH,width);
      ObjectSet(name,OBJPROP_RAY,ray);
     }
   else
     {
      ObjectDelete(name);
      ObjectCreate(name, OBJ_TREND, 0, tfrom, pfrom,tto,pto);

      if(type==1)
         ObjectSet(name, OBJPROP_STYLE, STYLE_SOLID);
      else if(type==2)
            ObjectSet(name, OBJPROP_STYLE, STYLE_DASHDOT);
         else
            ObjectSet(name, OBJPROP_STYLE, STYLE_DOT);
//----
      ObjectSet(name, OBJPROP_COLOR, Col);
      ObjectSet(name,OBJPROP_WIDTH,width);
      ObjectSet(name,OBJPROP_RAY,ray);
     }
  }
//+------------------------------------------------------------------+
//|                                                                  |
//+------------------------------------------------------------------+
void drawLabel()
  {
   ObjectCreate("KLabelKLines", OBJ_LABEL, 0, 0, 0);
   ObjectSetText("KLabelKLines","Kale Workshop", 7, "Arial", EMPTY);
   ObjectSet("KLabelKLines", OBJPROP_COLOR, DodgerBlue);
   ObjectSet("KLabelKLines", OBJPROP_CORNER, 0);
   ObjectSet("KLabelKLines", OBJPROP_XDISTANCE, 20);
   ObjectSet("KLabelKLines", OBJPROP_YDISTANCE, 20);
   ObjectCreate("InameKLines", OBJ_LABEL, 0, 0, 0);
   ObjectSetText("InameKLines","KLines", 9, "Arial", EMPTY);
   ObjectSet("InameKLines", OBJPROP_COLOR, DodgerBlue);
   ObjectSet("InameKLines", OBJPROP_CORNER, 0);
   ObjectSet("InameKLines", OBJPROP_XDISTANCE, 21);
   ObjectSet("InameKLines", OBJPROP_YDISTANCE, 32);
//----
   string desc="Indicator peroid: "+KLPeriod+" Bars";
   ObjectCreate("DescKLines", OBJ_LABEL, 0, 0, 0);
   ObjectSetText("DescKLines",desc, 8, "Arial", EMPTY);
   ObjectSet("DescKLines", OBJPROP_COLOR, DodgerBlue);
   ObjectSet("DescKLines", OBJPROP_CORNER, 0);
   ObjectSet("DescKLines", OBJPROP_XDISTANCE, 21);
   ObjectSet("DescKLines", OBJPROP_YDISTANCE, 48);
  }
//+------------------------------------------------------------------+
Comments