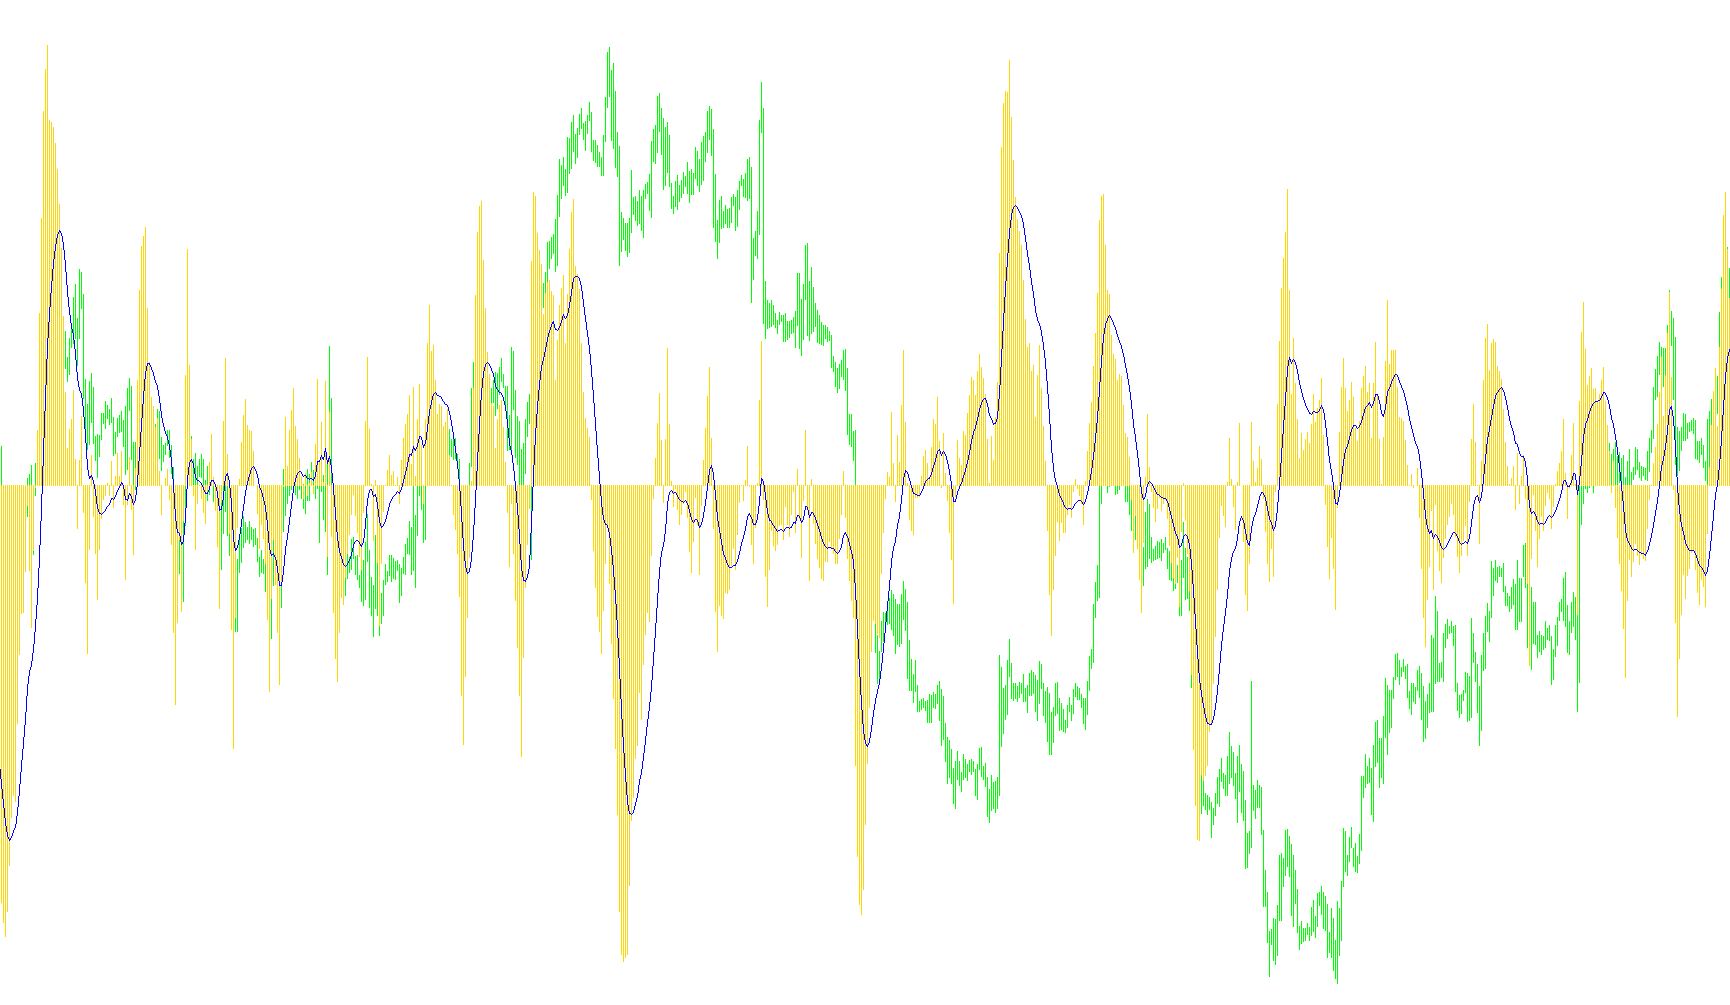
This script is a custom technical analysis tool designed for the MetaTrader platform to help traders visualize market momentum and volume flow. It identifies the relationship between price movement and trading activity to provide a clearer picture of "buying" versus "selling" pressure.
How the Logic Works
The indicator functions by processing data in three distinct stages:
1. Identifying Directional Movement The tool first looks at the average price of the current candle compared to the previous one. It calculates a specific price point for each candle and compares it to its neighbor.
- If the price moved upward, the script captures the trading volume as a positive value.
- If the price moved downward, the script captures that same volume as a negative value.
- If there was no change, the value remains neutral.
By doing this, the script essentially "weights" the market volume based on whether it was pushing the price up or down at that specific moment.
2. Calculating the Momentum (The Main Line) Once the directional volume is established, the tool applies two different smoothing filters (known as Exponential Moving Averages). It subtracts a slower trend line from a faster trend line using the weighted volume data.
- The result is a "Main" histogram that fluctuates based on the net difference between fast and slow momentum.
- When this value rises, it suggests stronger bullish momentum; when it falls, it suggests stronger bearish momentum.
3. The Signal Smoothing (The Signal Line) Finally, the tool applies one last smoothing filter to the Main momentum line. This creates a "Signal" line that helps traders see the overall trend of the momentum itself.
Visual Summary for Traders
- The Histogram: Represents the immediate strength of the price movement weighted by volume. It shows you the "velocity" of the current market direction.
- The Signal Line: Acts as a reference point. By watching how the histogram moves in relation to this signal line, traders can better identify when momentum is accelerating, decelerating, or potentially reversing.
In simple terms, this tool helps filter out market "noise" by focusing on volume-supported price movements, making it easier to see who is currently in control of the market.
//+------------------------------------------------------------------+
//|                                                          KVO.mq4 |
//|                                         Copyright © 2009, LeMan. |
//+------------------------------------------------------------------+
#property copyright "Copyright © 2009, LeMan."
#property link      "b-market@mail.ru"

#property indicator_separate_window
#property indicator_buffers 2
#property indicator_color1 Silver
#property indicator_color2 Red
//---- input parameters
extern int       FastEMA = 34;
extern int       SlowEMA = 55;
extern int       SignalEMA = 13;
//---- buffers
double MainBuffer[];
double SignalBuffer[];
double v[];
//+------------------------------------------------------------------+
//| Custom indicator initialization function                         |
//+------------------------------------------------------------------+
int init()
  {
//---- indicators
   IndicatorBuffers(3);
   SetIndexStyle(0, DRAW_HISTOGRAM);
   SetIndexStyle(1, DRAW_LINE);
   SetIndexBuffer(0, MainBuffer);
   SetIndexBuffer(1, SignalBuffer);
   SetIndexBuffer(2, v);
   IndicatorShortName("KVO ("+FastEMA+","+SlowEMA+","+SignalEMA+") ");
   SetIndexLabel(0,"Main");
   SetIndexLabel(1,"Signal");
//----
   return(0);
  }
//+------------------------------------------------------------------+
//| Custom indicator deinitialization function                       |
//+------------------------------------------------------------------+
int deinit()
  {
//----

//----
   return(0);
  }
//+------------------------------------------------------------------+
//| Custom indicator iteration function                              |
//+------------------------------------------------------------------+
int start()
  {
//----
   int  i, limit, counted = IndicatorCounted();
   double tpc, tpp;
//---- last counted bar will be recounted
   if (counted > 0) {
      counted--;
   }
   limit = Bars - counted;
//----
   for (i = limit; i >= 0; i--) {
      tpc = (High[i] + Low[i] + Close[i])/3;
      tpp = (High[i+1] + Low[i+1] + Close[i+1])/3;
      if (tpc > tpp) {
         v[i] = Volume[i];
      }
      if (tpc < tpp) {
         v[i] = -Volume[i];
      }
      if (tpc == tpp) {
         v[i] = 0.0;
      }


   }
   for (i = limit; i >= 0; i--) {
      MainBuffer[i] = iMAOnArray(v, 0, FastEMA, 0, MODE_EMA, i) - iMAOnArray(v, 0, SlowEMA, 0, MODE_EMA, i);
   }
   for (i = limit; i >= 0; i--) {
      SignalBuffer[i] = iMAOnArray(MainBuffer, 0, SignalEMA, 0, MODE_EMA, i);
   }
//----
   return(0);
  }
//+------------------------------------------------------------------+
Comments