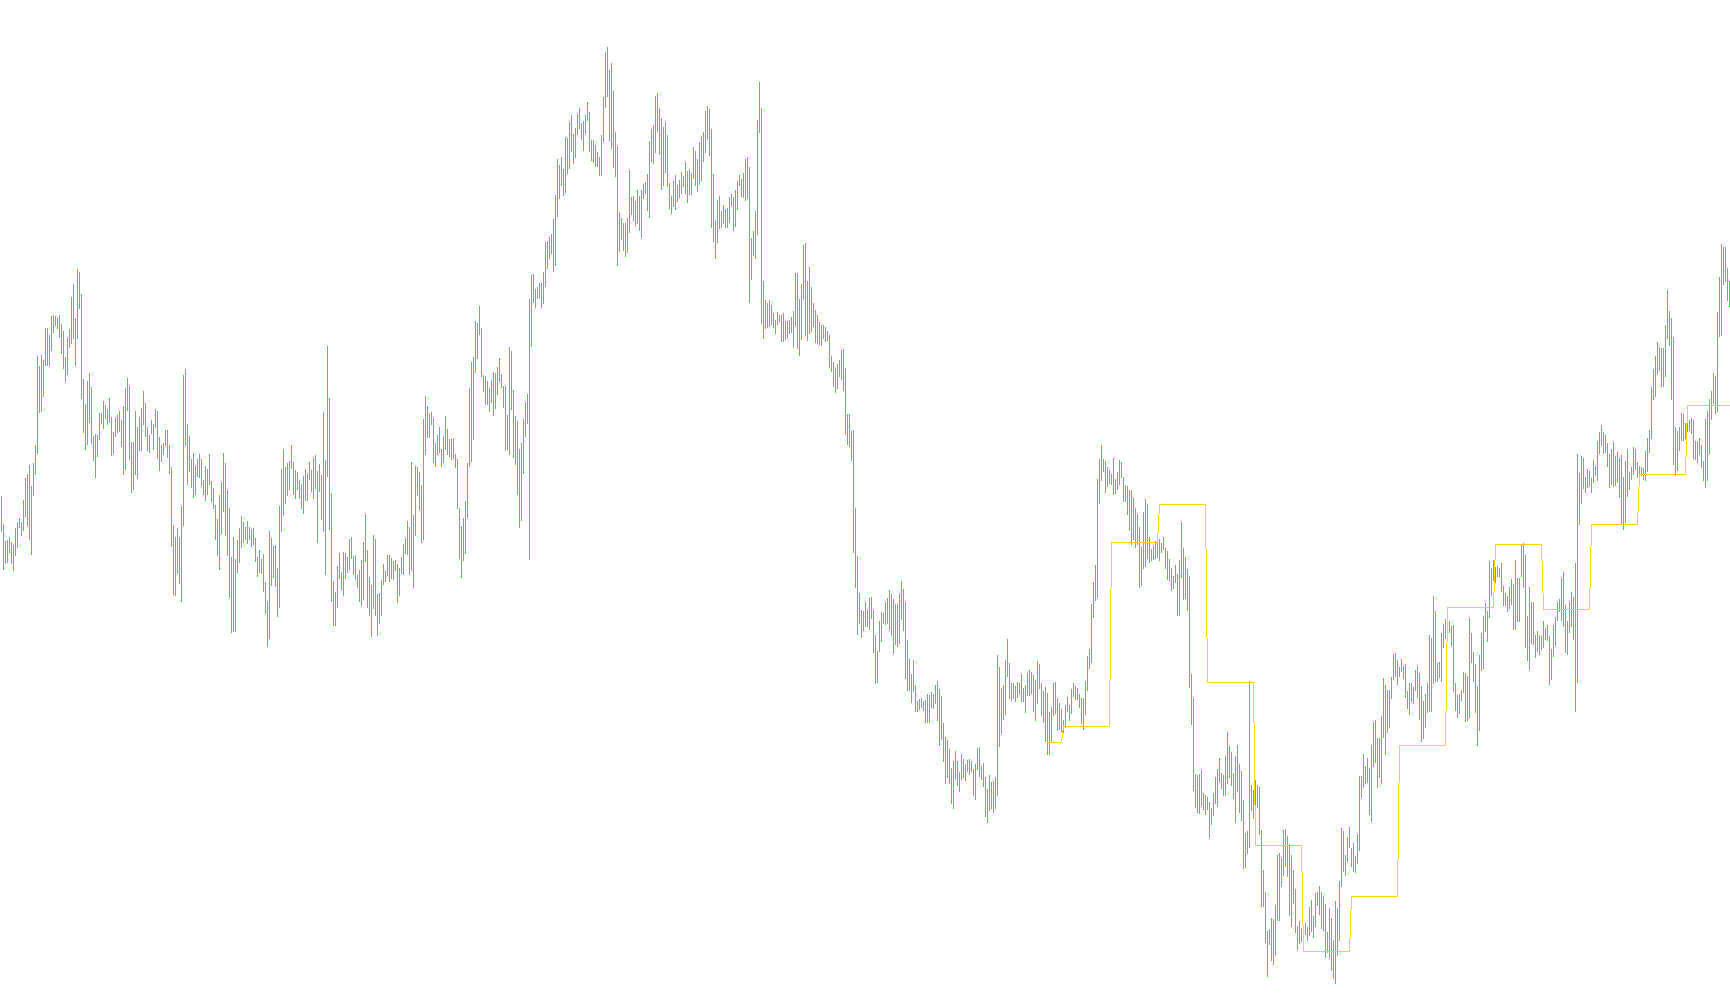
This script functions as a custom technical analysis tool designed to identify specific price trends by analyzing the opening prices of historical trading days. Instead of looking at every single price fluctuation (like ticks or minutes), it focuses on the "Opening Price" of each new day to determine the broader direction of the market.
Core Logic and Mechanism
The tool works by evaluating a sequence of recent daily openings to calculate a linear trend. Here is how it processes that information:
- Data Sampling: The script looks back at a specific number of historical data points (defined by the "viborka" setting) to ensure it has enough information to make an accurate calculation.
- Daily Filtering: It identifies the exact moment a new day begins. When it detects a change in the date, it treats that day's opening price as a key data point.
- Trend Calculation: Rather than just connecting dots, the script uses a mathematical regression method. It takes the opening prices from the most recent days (based on your "perMA1" setting) and calculates a "best-fit" line. This means it determines the general slope of the price movement over that period, smoothing out minor daily fluctuations.
- Projection: Once it establishes the slope and the position of this trend line, it calculates a specific value (the result of the regression). This value is then plotted on your chart as a yellow line.
Summary for the User
In simple terms, this indicator ignores the "noise" of intraday trading. It looks at where the market opens each day, determines the mathematical trajectory of those opening prices over a set period, and projects that trend onto your chart. It is intended to help you visualize the underlying momentum of daily price action rather than short-term volatility.
#property copyright "Copyright © 2003 Ëàðèîíîâ Àëåêñåé"
#property link      "http://fx.winm.ru"

#property indicator_chart_window
#property indicator_buffers 1
#property indicator_color1 Yellow

extern int perMA1=3;
extern int viborka=300;
extern int Shift=0;
extern double Band=0.0;
double Buf1[];

int init()
  {

   IndicatorDigits(Digits);
   //SetIndexStyle(0,DRAW_ARROW);
   //SetIndexArrow(0,160);
   SetIndexBuffer(0,Buf1);
  SetIndexShift(0,Shift);
    SetIndexLabel(0,"per:"+perMA1+"");

   return(0);
  }
int start()
{
  double b,a1,y1,y2,op;
   for(int i=0; i<viborka; i++)
   {
     double sumXY=0.0,sumX=0.0,sumY=0.0,sumX2=0.0;
     int ll,hh,mm=0;

	  for(int j=i; j<=99999; j++)
	  {

	       if (TimeDay(Time[j])!=TimeDay(Time[j+1]))
	       {
	          mm++;
	          op=Open[j];
		       sumXY=sumXY+(mm*op);
		       sumX=sumX+mm;
		       sumY=sumY+op;
		       sumX2=sumX2+(mm*mm);
		    }
		    if (mm>=perMA1+1) break;
	  }
	b=(((perMA1+1)*sumXY)-(sumX*sumY))/(((perMA1+1)*sumX2)-(sumX*sumX));
	a1=(sumY-(b*sumX))/(perMA1+1);

	y2=a1+b;
   Buf1[i] = y2;
   }
}
Comments