Linear Regression Line_v1
Download script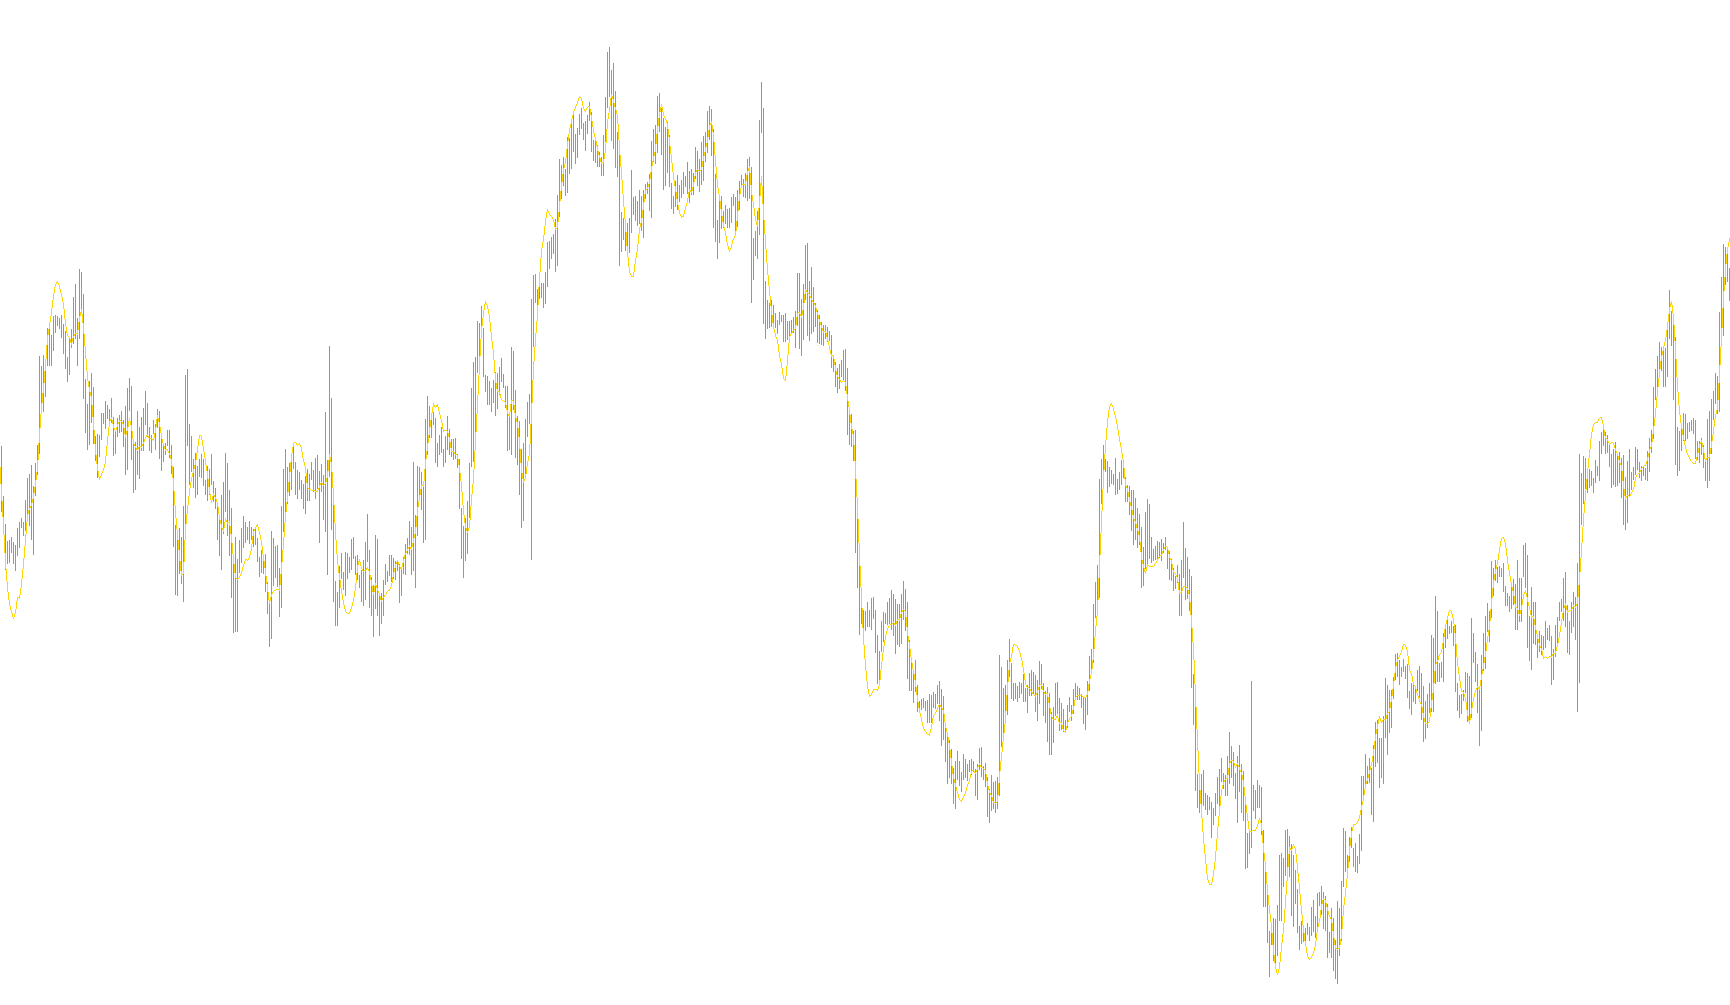
This tool is designed to provide traders with a clearer view of market trends by applying a mathematical concept known as Linear Regression to price data. Instead of simply looking at the current price, this indicator calculates a "line of best fit" to help identify the underlying direction of the market over a specific timeframe.
How the Logic Works
The core objective of this script is to smooth out the "noise" of daily price fluctuations to reveal the prevailing trend. Here is a step-by-step breakdown of how it achieves this:
1. Data Collection (The Lookback Period) The user can define a specific period (for example, 14 candles). The tool looks back at the closing prices for that exact number of bars to gather data. By focusing on a set window, it ensures that the trend analysis remains relevant to recent market activity.
2. Statistical Calculation Once the data is gathered, the script performs a series of mathematical calculations to determine the relationship between time (the sequence of candles) and price. It calculates several components:
- The Slope: It determines the angle at which the price is moving—whether it is trending upward, downward, or moving sideways.
- The Intercept: It finds the starting point for the line based on the gathered data.
- The Correlation: It measures how closely the actual prices hug the calculated trend line, which helps in understanding the strength and consistency of the current movement.
3. Visualizing the Trend After calculating these values, the script places a single, continuous orange line on your chart. This line represents the "average" path the price has taken during the chosen period.
Practical Application for Traders
Because this tool calculates a mathematical average of the trend rather than just reacting to the most recent candle, it serves as a visual guide:
- Trend Identification: If the line is sloping upward, the primary market sentiment over that period is bullish. If it is sloping downward, the sentiment is bearish.
- Price Relation: Traders can observe where the current price sits in relation to the regression line. When the price is significantly above the line, it may indicate an overextended move; when it is significantly below, it may suggest a retracement or a deeper trend.
- Stability: By using linear regression, the tool provides a more stable perspective than standard moving averages, as it accounts for the overall trajectory of the data points rather than just adding up previous prices.
/*-----------------------------+
|			       |
| Shared by www.Aptrafx.com    |
|			       |
+------------------------------*/

//+------------------------------------------------------------------+
//|                                       Linear Regression Line.mq4 |
//|                                                      MQL Service |
//|                                           scripts@mqlservice.com |
//+------------------------------------------------------------------+
#property copyright "MQL Service"
#property link      "www.mqlservice.com"

#property indicator_chart_window
#property indicator_buffers 1
#property indicator_color1 Orange
#property indicator_width1 2
//---- input parameters
extern int LRLPeriod=14;
//---- buffers
double LRLBuffer[];

int shift=0;
int n=0;
double sumx=0, sumy=0, sumxy=0, sumx2=0, sumy2=0;
double m=0, yint=0, r=0;
//+------------------------------------------------------------------+
//|                    INITIALIZATION FUNCTION                       |
//+------------------------------------------------------------------+
int init()
  {
//---- indicators
   SetIndexStyle(0,DRAW_LINE);
   SetIndexBuffer(0,LRLBuffer);
   IndicatorDigits(Digits);
   if(LRLPeriod < 2) LRLPeriod = 2;
   IndicatorShortName("Linear Regression Line ("+LRLPeriod+")");
   SetIndexDrawBegin(0,LRLPeriod+2);
   IndicatorDigits(MarketInfo(Symbol(),MODE_DIGITS)+4);
//----
   return(0);
  }
//+------------------------------------------------------------------+
//|                   DEINITIALIZATION FUNCTION                      |
//+------------------------------------------------------------------+
int deinit()
  {
   return(0);
  }
//+------------------------------------------------------------------+
//|                      ITERATION FUNCTION                          |
//+------------------------------------------------------------------+
int start()
  {
   int limit;
   int counted_bars=IndicatorCounted();
   if(counted_bars<0) counted_bars=0;
   if(counted_bars>0) counted_bars--;
   limit=Bars-counted_bars;

   for(int shift=limit-1; shift>=0; shift--)
      {
         sumx = 0;
         sumy = 0;
         sumxy = 0;
         sumx2 = 0;
         sumy2 = 0;
         for(n = 0; n <= LRLPeriod-1; n++)
             {
               sumx = sumx + n;
               sumy = sumy + Close[shift + n];
               sumxy = sumxy + n * Close[shift + n];
               sumx2 = sumx2 + n * n;
               sumy2 = sumy2 + Close[shift + n] * Close[shift + n];
             }
         m=(LRLPeriod*sumxy-sumx*sumy)/(LRLPeriod*sumx2-sumx*sumx);
         yint=(sumy+m*sumx)/LRLPeriod;
         r=(LRLPeriod*sumxy-sumx*sumy)/MathSqrt((LRLPeriod*sumx2-sumx*sumx)*(LRLPeriod*sumy2-sumy*sumy));
         LRLBuffer[shift]=yint-m*LRLPeriod;
         //Print (" "+shift+" "+LRLBuffer[shift]);
      }
   return(0);
  }
//+------------------------------------------------------------------+
Comments