Linear_Regression_Line_wAppliedPrice
Download script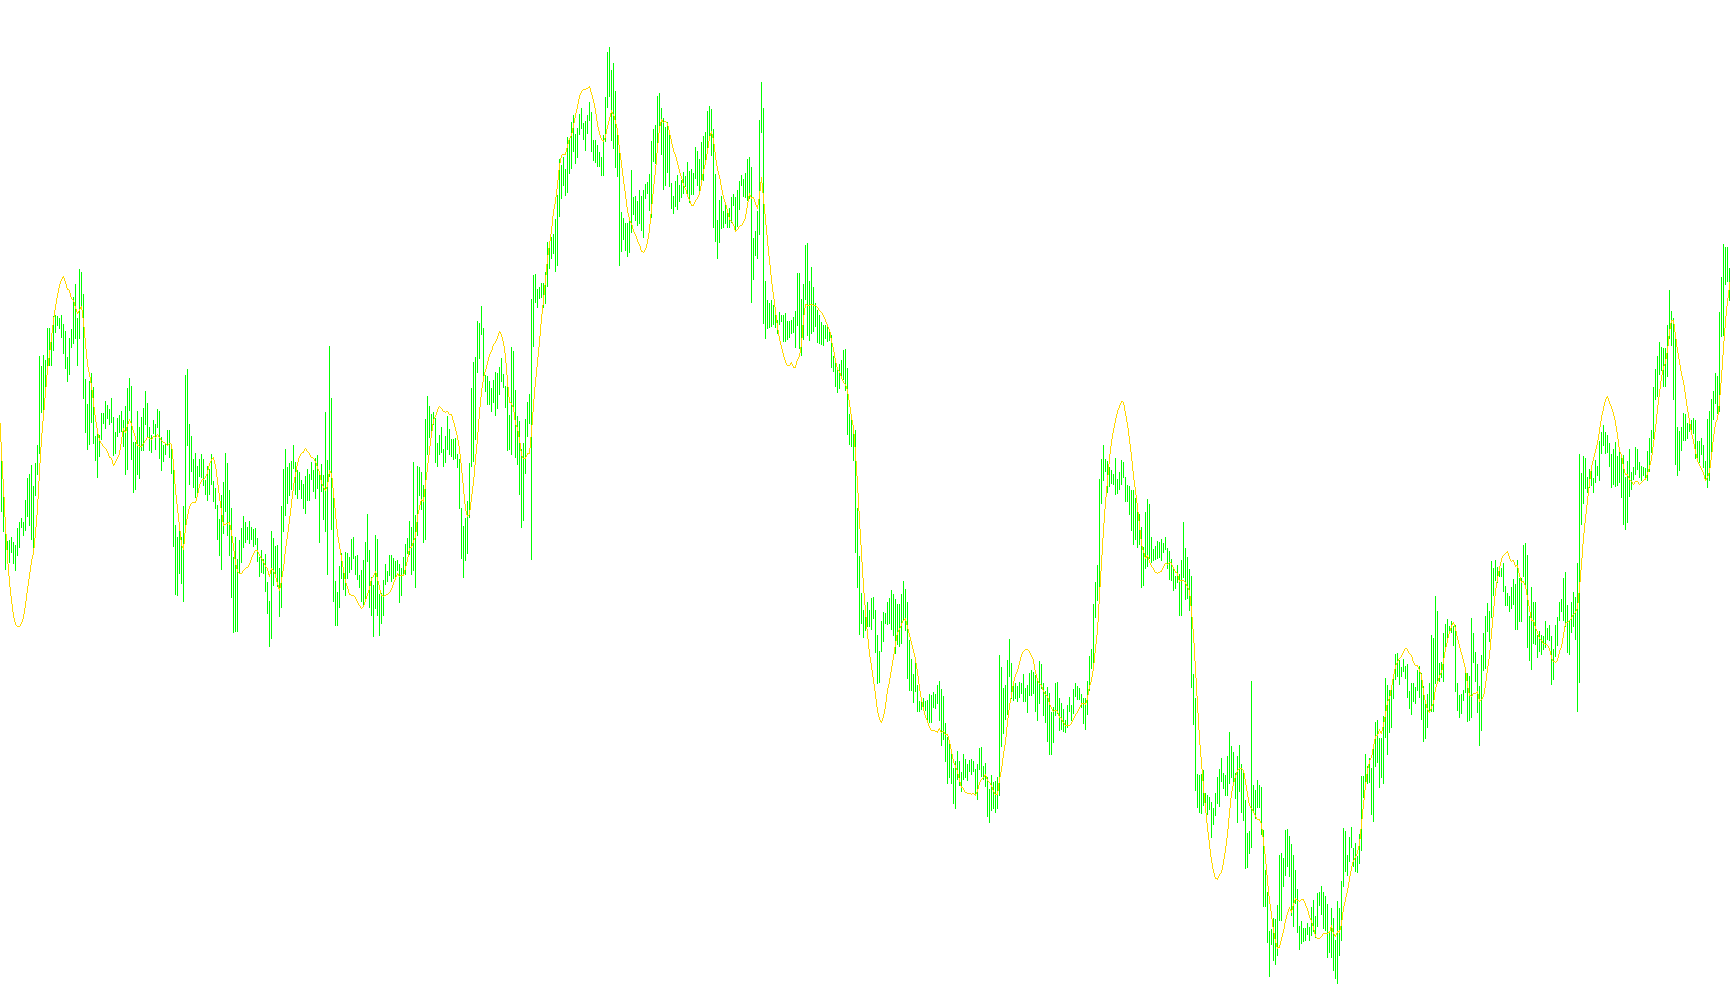
This tool is designed to analyze market trends by calculating and displaying a Linear Regression Line on your trading chart. Unlike standard moving averages that simply smooth out price data, this script uses mathematical regression to identify the "line of best fit" for a specific period of time.
How it Works
The logic behind this indicator can be broken down into three main components:
1. Data Selection (Price Types) The tool allows you to choose which specific price data points from each candle should be used to calculate the trend. You can select from various options, including:
- Standard prices like Open, High, Low, or Close.
- Calculated averages such as the Median (average of high and low), the Typical Price (average of high, low, and close), or a Weighted Price.
2. The Calculation Period The "Period" setting determines how much historical data the tool looks at to draw the line. For example, if you set a period of 21, the script examines the last 21 candles to determine the current trajectory. A longer period will provide a smoother, more generalized trend line, while a shorter period will react more quickly to recent price fluctuations.
3. Mathematical Trend Analysis Instead of just connecting dots, the script performs a statistical calculation known as Linear Regression:
- Trend Slope: It calculates the angle or "slope" of the price movement over your chosen period.
- Intercept Point: It determines where that trend line sits in relation to the current market price.
- Best Fit: By calculating these values, it identifies the path that minimizes the distance between the actual price points and the theoretical line.
Visual Output
The result is a solid blue line displayed on your chart window. This line acts as a visual guide to help traders see the underlying direction of the market. Because it uses regression math, it effectively filters out "noise" (minor, temporary price spikes) to show you the broader momentum of the asset.
//+------------------------------------------------------------------+
//|                                       Linear Regression Line.mq4 |
//+------------------------------------------------------------------+
#property copyright "MetaTrader 4"
#property link      "http://metatrader.com"
//---- indicator settings
#property indicator_chart_window
#property indicator_buffers 1
#property indicator_color1 Blue
#property indicator_width1 2
//---- input parameters
extern int LRLPeriod=21;
extern string  p = "--Applied Price Types--";
extern string  p0 = " 0 = close";
extern string  p1 = " 1 = open";
extern string  p2 = " 2 = high";
extern string  p3 = " 3 = low";
extern string  p4 = " 4 = median(high+low)/2";
extern string  p5 = " 5 = typical(high+low+close)/3";
extern string  p6 = " 6 = weighted(high+low+close+close)/4";
extern int       MAAppliedPrice = 0;
//---- buffers
double LRLBuffer[];

int shift=0;
int n=0;
double sumx=0, sumy=0, sumxy=0, sumx2=0, sumy2=0;
double m=0, yint=0, r=0;
//+------------------------------------------------------------------+
//| Custom indicator initialization function                         |
//+------------------------------------------------------------------+
int init()
  {
//---- indicators
   SetIndexStyle(0,DRAW_LINE);
   SetIndexBuffer(0,LRLBuffer);
   IndicatorDigits(Digits);
   if(LRLPeriod < 2) LRLPeriod = 2;
   IndicatorShortName("Linear Regression Line ("+LRLPeriod+")");
   SetIndexDrawBegin(0,LRLPeriod+2);
   IndicatorDigits(MarketInfo(Symbol(),MODE_DIGITS)+4);
//----
   return(0);
  }
//+------------------------------------------------------------------+
//| Custom indicator deinitialization function                       |
//+------------------------------------------------------------------+
int deinit()
  {
   return(0);
  }
//+------------------------------------------------------------------+
//| Linear Regression Line                                           |
//+------------------------------------------------------------------+
int start()
  {
   double myPrice;
   int limit;
   int counted_bars=IndicatorCounted();
   if(counted_bars<0) counted_bars=0;
   if(counted_bars>0) counted_bars--;
   limit=Bars-counted_bars;

   for(int shift=limit-1; shift>=0; shift--)
      {
         sumx = 0;
         sumy = 0;
         sumxy = 0;
         sumx2 = 0;
         sumy2 = 0;
         for(n = 0; n <= LRLPeriod-1; n++)
             {
               myPrice = Price(MAAppliedPrice, shift+n);
               sumx = sumx + n;
               sumy = sumy + myPrice;
               sumxy = sumxy + n * myPrice;
               sumx2 = sumx2 + n * n;
               sumy2 = sumy2 + myPrice * myPrice;
             }
         m=(LRLPeriod*sumxy-sumx*sumy)/(LRLPeriod*sumx2-sumx*sumx);
         yint=(sumy+m*sumx)/LRLPeriod;
         r=(LRLPeriod*sumxy-sumx*sumy)/MathSqrt((LRLPeriod*sumx2-sumx*sumx)*(LRLPeriod*sumy2-sumy*sumy));
         LRLBuffer[shift]=MathFloor((yint-m*LRLPeriod)/Point) * Point;
      }
   return(0);
  }

double Price(int prMode, int myShift)
{

   double pr;
   switch (prMode)
   {
     case 0: pr = Close[myShift];break;
     case 1: pr = Open[myShift];break;
     case 2: pr = High[myShift];break;
     case 3: pr = Low[myShift];break;
     case 4: pr = (High[myShift] + Low[myShift])/2;break;
     case 5: pr = (High[myShift] + Low[myShift] + Close[myShift])/3;break;
     case 6: pr = (High[myShift] + Low[myShift] + 2 * Close[myShift])/4;break;
   }

     return (pr);
}

//+------------------------------------------------------------------+
Comments