LinearRegressionBands[1]
Download script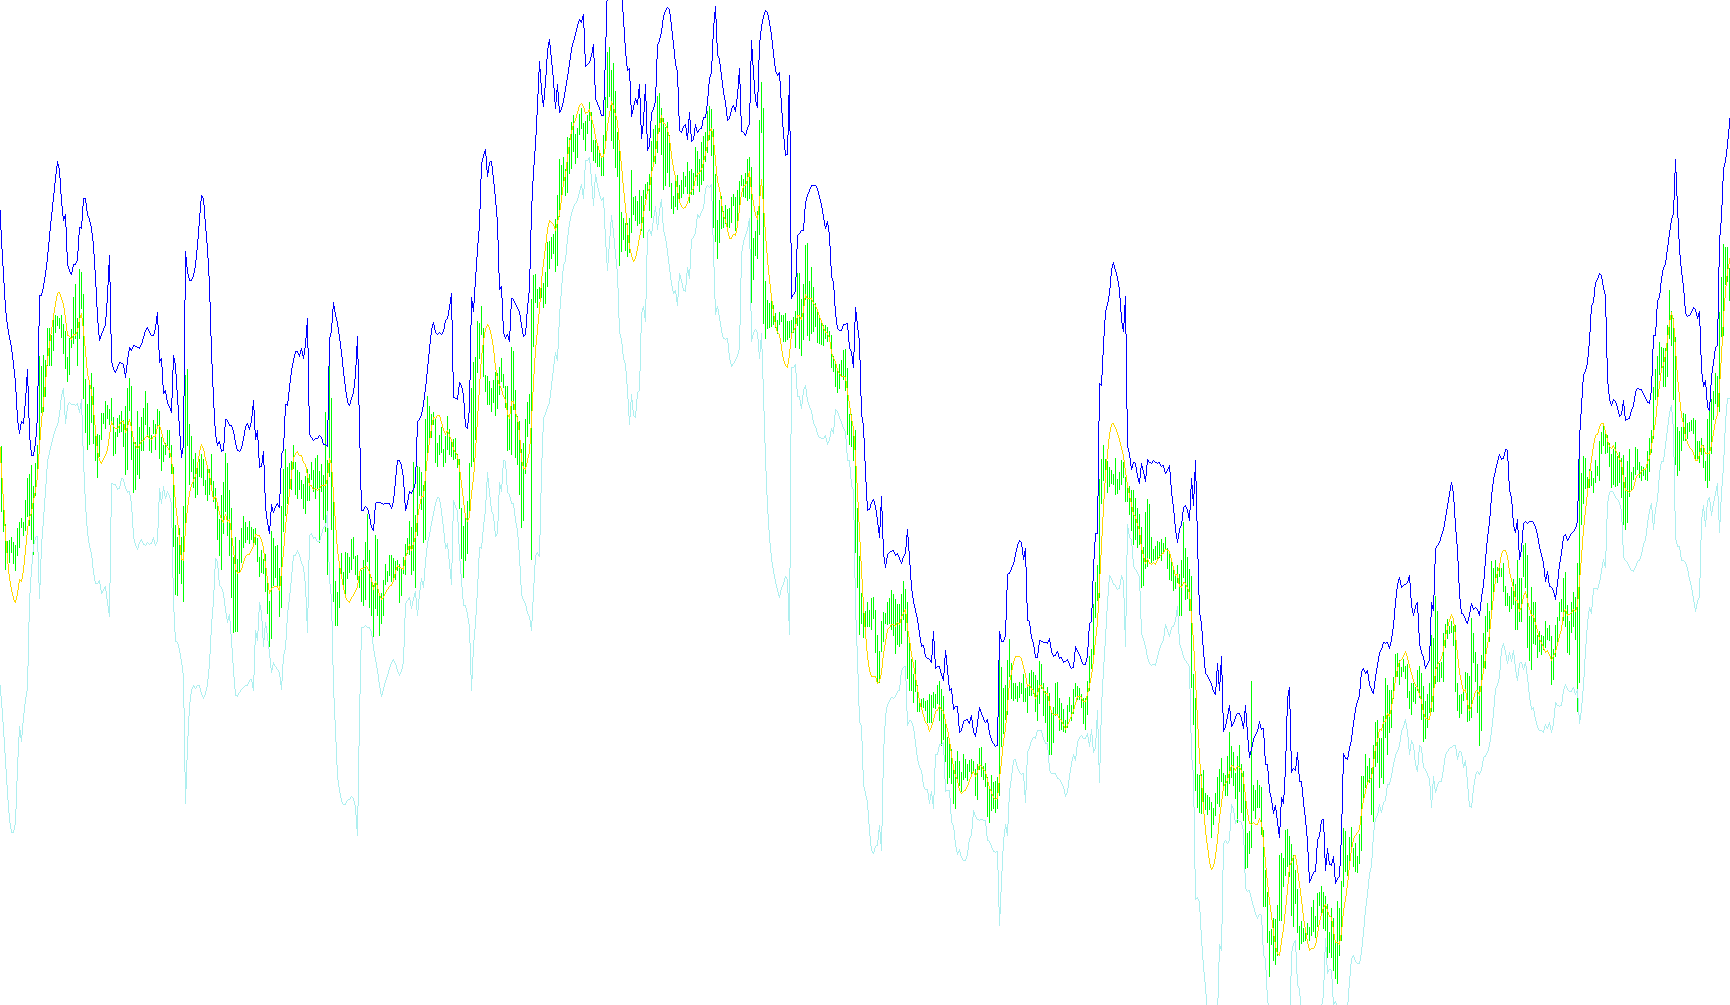
This script is designed to analyze price trends by calculating a statistical "trend line" and identifying the surrounding range of market volatility. Rather than simply looking at moving averages, it uses a linear regression model to determine where the price "should" be based on historical behavior over a specific timeframe.
Core Logic Overview
The tool operates by examining a set number of past price points (the lookback period) to create a mathematical best-fit line. It treats the price history as a series of data points and calculates a trajectory that minimizes the distance between those points. This allows the indicator to distinguish between short-term market "noise" and the actual underlying direction of the trend.
Key Components of the Analysis
The logic can be broken down into three primary functions:
- Trend Projection (The Center Line): The script calculates a linear regression to find a starting value for the current price trend. This serves as the baseline, representing the "fair value" or the expected path of the price based on recent history.
- Volatility Measurement: Once the trend line is established, the tool measures the "maximal deviation." It looks at how far the actual market price has strayed from the calculated trend line at any point during the lookback period. This identifies the maximum swing or intensity of the market's movement.
- Dynamic Channels (Upper and Lower Boundaries): Using the standard error settings provided by the user, the script creates a corridor around the center trend line.
- The Upper Boundary is calculated by adding a multiple of the volatility to the trend value.
- The Lower Boundary is calculated by subtracting that same multiple from the trend value.
Visual Summary
On a chart, this logic results in a visual corridor. The center line shows you the direction and strength of the current trend, while the upper and lower boundaries define the "normal" trading range. When the price moves outside of these boundaries, it suggests that the market is experiencing an unusual expansion or contraction compared to its recent historical behavior.
#property indicator_chart_window
#property indicator_buffers 3
#property indicator_color1 Green
#property indicator_color2 Green
#property indicator_color3 Green

//----------------------------------
extern int iPeriod=14;
extern double StdFrrors=2;
//----------------------------------
double ci[],uch[],dch[];
double L_Value, M_Dev;
//================================================
int init(){

   SetIndexStyle(0,DRAW_LINE);
   SetIndexBuffer(0,ci);

   SetIndexStyle(1,DRAW_LINE);
   SetIndexBuffer(1,uch);

   SetIndexStyle(2,DRAW_LINE);
   SetIndexBuffer(2,dch);

   return(0);}
//================================================

int start(){
   int limit;
	int counted_bars=IndicatorCounted(); // îïðåäåëèì êîëè÷åñòâî ïðîñ÷èòàíûõ áàðîâ ó èíäèêàòîðà
	  if(counted_bars>0){
	     counted_bars--;
	  }
	limit=Bars-counted_bars;

	for(int i=0;i<limit;i++){
	  LR_Close(i,i+iPeriod);
	  ci[i]=L_Value;
	  uch[i]=L_Value+StdFrrors*M_Dev;
	  dch[i]=L_Value-StdFrrors*M_Dev;
	}
 return(0);
}
//+------------------------------------------------------------------+
void LR_Close(int i0,int i1){
  int m_pos[2];
  m_pos[0]=i0;
  m_pos[1]=i1;
  double m_value[2];
   int n=m_pos[1]-m_pos[0]+1;
//---- calculate price values
   double value=Close[m_pos[0]];
   double a,b,c;
   double sumy=value;
   double sumx=0.0;
   double sumxy=0.0;
   double sumx2=0.0;
   for(int i=1; i<n; i++)
     {
      value=Close[m_pos[0]+i];
      sumy+=value;
      sumxy+=value*i;
      sumx+=i;
      sumx2+=i*i;

     }
   c=sumx2*n-sumx*sumx;
   if(c==0.0) return;
   b=(sumxy*n-sumx*sumy)/c;
   a=(sumy-sumx*b)/n;
   m_value[0]=a;
   m_value[1]=a+b*n;

//---- maximal deviation
   double maxdev=0;
   double deviation=0;
   double dvalue=a;
   for(i=0; i<n; i++)
     {
      value=Close[m_pos[0]+i];
      dvalue+=b;
      deviation=MathAbs(value-dvalue);
      if(maxdev<=deviation) maxdev=deviation;
     }
   L_Value=m_value[0];
   M_Dev=maxdev;
  }
Comments