LineFrakDown
Download script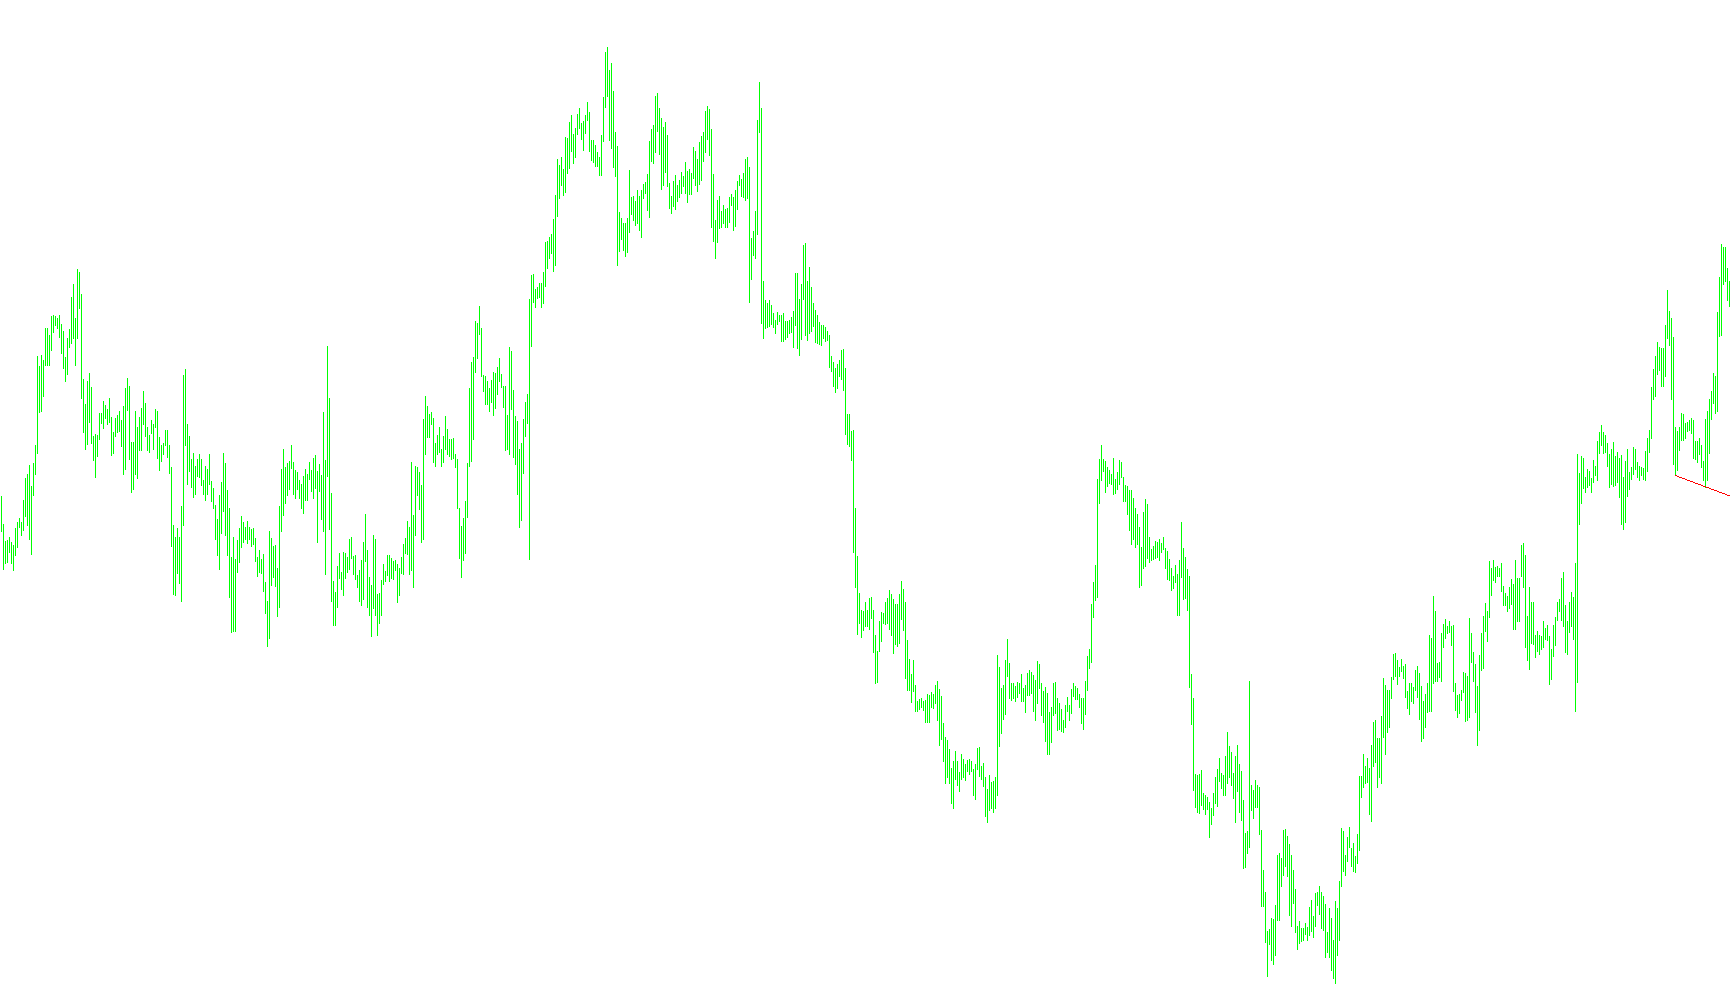
This tool is designed to automatically identify and display specific price patterns on your trading chart to help highlight potential support levels. It functions by scanning historical market data to locate specific "fractal" points—which are essentially peaks or valleys in price action that indicate a temporary change in direction.
How the Logic Works
1. Identifying Market Turning Points The script constantly monitors the price movement to find the most recent occurrences of "lower fractals." In trading terms, these are the low points in the market where the price has bounced back up after a decline. The tool looks backward through the candles on your chart until it finds two distinct instances of these turning points.
2. Determining the Support Zone Once the script identifies these two specific low points, it uses them to define a trajectory. Instead of just marking a single price point, it connects these two historical lows to visualize the path of the market's floor.
3. Visual Representation on the Chart After finding these points, the tool automatically draws a trend line on your screen:
- Start Point: It anchors one end of the line at the location of the most recent low point.
- End Point: It anchors the other end at the previous significant low point it discovered.
- Extension: The line is set as a "ray," meaning it extends forward into the future, allowing you to see where the current support level might sit as new prices are formed.
Summary for the Trader
Essentially, this script acts as an automated "support hunter." Rather than you having to manually guess where the price might hold steady, the tool scans the history for confirmed price bounces and draws a clear line connecting them. This allows you to see the prevailing trend of support levels at a glance, helping you visualize where the market has historically found its footing.
//+------------------------------------------------------------------+
//|                                                     LineFrakDown.mq4 |
//|                                                     Yuriy Tokman |
//|                                            yuriytokman@gmail.com |
//+------------------------------------------------------------------+
#property copyright "Yuriy Tokman"
#property link      "yuriytokman@gmail.com"

#property indicator_chart_window
//+------------------------------------------------------------------+
//| Custom indicator initialization function                         |
//+------------------------------------------------------------------+
int init()
  {
//---- indicators
    ObjectCreate("Saport", OBJ_TREND, 0,0,0,0,0);//ñîçäàíèå òðåíäîâîé ëèíèè
//----
   return(0);
  }
//+------------------------------------------------------------------+
//| Custom indicator deinitialization function                       |
//+------------------------------------------------------------------+
int deinit()
  {
//----
  ObjectDelete("Saport");//óäàëåíèå îáåêòà
//----
   return(0);
  }
//+------------------------------------------------------------------+
//| Custom indicator iteration function                              |
//+------------------------------------------------------------------+
int start()
  {

//----
  double F1=0, F3=0, F13;    // íîìåðà ôðàêòàëîâ
  int    B1, B3, SR=2;               // íîìåðà áàðîâ

  while(F3==0)                       //ïîèñê ôðàêòàëîâ
  {
    F13=iFractals(NULL,0,MODE_LOWER,SR);
    if (F13!=0)
    {
      if      (F1==0){B1=SR; F1=F13;}
      else if (F3==0){B3=SR; F3=F13;}
    }
    SR++;
  }
    ObjectSet("Saport", OBJPROP_TIME1 ,iTime(NULL,0,B3));
    ObjectSet("Saport", OBJPROP_TIME2 ,iTime(NULL,0,B1));
    ObjectSet("Saport", OBJPROP_PRICE1,iLow(NULL,0,B3));
    ObjectSet("Saport", OBJPROP_PRICE2,iLow(NULL,0,B1));
    ObjectSet("Saport", OBJPROP_RAY   , True);


//----
   return(0);
  }
//+------------------------------------------------------------------+
Comments