LK_FDI_V2
Download script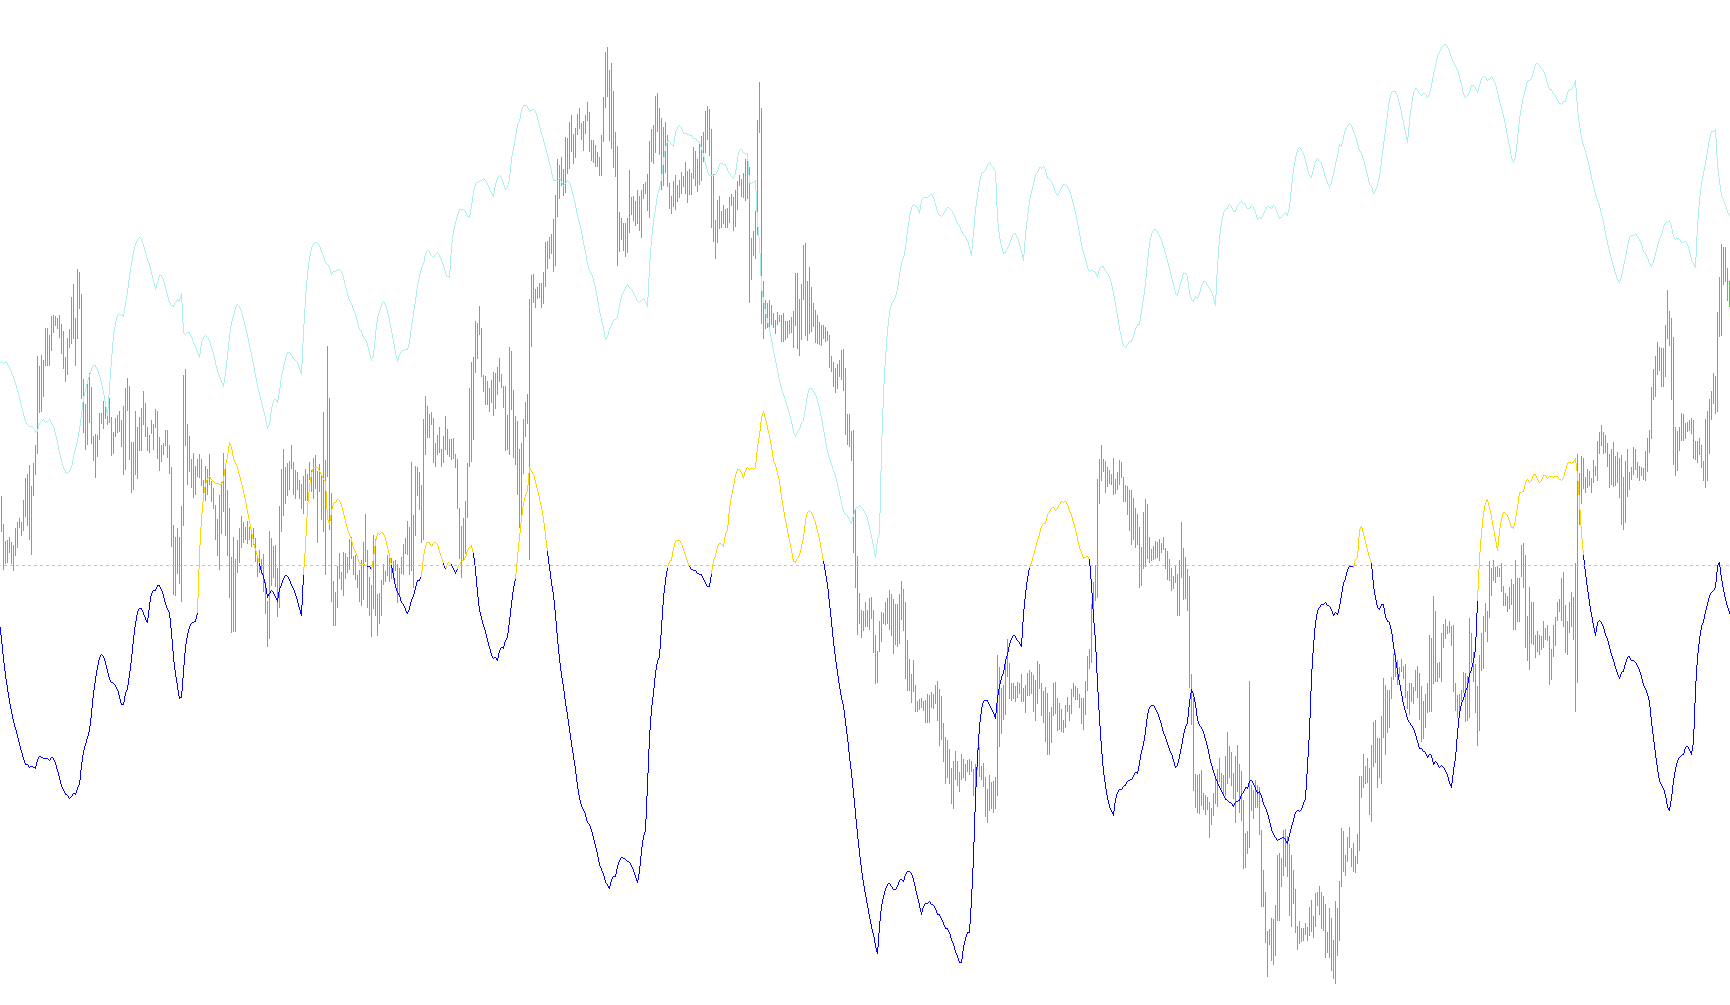
This tool is designed as a visual technical indicator for trading platforms to help identify specific price movements and trends by calculating the intensity of market activity. It operates in a separate window below your main price chart, providing a smoothed visualization of market dynamics rather than raw price action.
Core Logic Overview
The script functions by analyzing the relationship between current price changes and the overall historical range within a specific look-back period. It essentially measures how "aggressive" or "stable" the market is moving at any given moment.
Key Components of the Analysis:
- Price Selection: The indicator allows you to choose which type of price data to analyze (such as Close, Open, High, Low, Median, Typical, or Weighted prices). This gives you the flexibility to tailor the calculation to your specific trading style.
- Trend and Range Detection: The logic calculates a "Fractal Dimension Indicator" (FDI) value. This is a mathematical way of determining if the market is moving in a structured trend or if it is behaving erratically.
- Smoothing Mechanism: To prevent the data from being too "jittery" or noisy, the script applies a smoothing algorithm. This ensures that the lines displayed on your screen are fluid and easier to read, highlighting significant moves while filtering out minor market fluctuations.
- Dynamic Level Filtering: A key feature of this script is the use of a "Random Level" threshold. The indicator compares the calculated market intensity against this user-defined level:
- If the movement exceeds this level, the tool identifies it as a significant Range or high-intensity area.
- If it stays below this level, it tracks the underlying Trend.
- Delta Tracking: The script also includes a "dFDI" component. This specifically tracks the change in the fractal dimension over time (the velocity of the trend change), allowing you to see how quickly momentum is shifting from one state to another.
Visual Output
The final result is a set of colored lines that move independently in a sub-window. By watching these lines, traders can visually distinguish between periods of established trending behavior and periods where the market is experiencing high-intensity volatility or price expansion.
//+------------------------------------------------------------------+
//|                                                    LK_FDI_v2.mq4 |
//|                                 Copyright © 2009, Leif Karlsson. |
//|                                        Leffemannen1973@telia.com |
//+------------------------------------------------------------------+
//| Please feel free to copy, modify and / or redistribute this      |
//| software / source code in any way you see fit.                   |
//+------------------------------------------------------------------+
//+ ********************* Shameless Ad. **************************** +
//+ * I do custom programing jobs in C, Java, X86 Assembler & MQL4 * +
//+ ***** Pleace do not hesitate to get in contact if you nead ***** +
//+ ***** something special: EA, indicator or somthing else. ******* +
//+ ****************** Leffemannen1973@telia.com ******************* +
//+ **************************************************************** +
//+------------------------------------------------------------------+
#property copyright "Copyright © 2009, Leif Kalrsson"
#property link      "mailto://Leffemannen1973@telia.com"
//+------------------------------------------------------------------+
#property  indicator_separate_window
#property  indicator_buffers 3
#property  indicator_color1  Blue
#property  indicator_color2  Yellow
#property  indicator_color3  Green
#property  indicator_width1  1
//+------------------------------------------------------------------+
extern int WindowSize = 60;
extern int SmoothPeriod = 5;
extern bool LinearWeighted  = true;
extern string AppliedPriceText1 = "Close: 0, Open: 1, High: 2, Low: 3";
extern string AppliedPriceText2 = "Median: 4, Typical: 5, Weighted: 6";
extern int AppliedPrice = 0;
extern int PriceShift = 0;
extern bool dFDI = true;
extern double RandomLevel = 1.5;
extern int MaxBars = 4000;
//+------------------------------------------------------------------+
double RangeBuffer[];
double TrendBuffer[];
double dFDIBuffer[];
double Price[];
double dPrice[];
double Alpha = 0.0;
//+------------------------------------------------------------------+
int init() {

   	IndicatorDigits(Digits+1);

   	IndicatorBuffers(5);

   	SetIndexStyle(0, DRAW_LINE);
   	SetIndexStyle(1, DRAW_LINE);
   	SetIndexStyle(2, DRAW_LINE);
   	SetIndexBuffer(0, RangeBuffer);
   	SetIndexBuffer(1, TrendBuffer);
   	SetIndexBuffer(2, dFDIBuffer);
   	SetIndexBuffer(3, Price);
   	SetIndexBuffer(4, dPrice);
   	SetLevelValue(0, RandomLevel);

   	IndicatorShortName("LK_FDI_V2, WindowSize: " + WindowSize + ", SmoothPeriod: " + SmoothPeriod + " ");

   	Alpha = 2.0/(SmoothPeriod + 1.0);

   	return(0);
}
//+------------------------------------------------------------------+
double FDI(double Data[], int p, bool w, int Shift) {

	double Df = 0.0;
	double Temp = 0.0;
	double Range = 0.0;
	int i = 0;

	Range = Data[ArrayMaximum(Data, p, Shift)] - Data[ArrayMinimum(Data, p, Shift)];

	i = p-2;
	while(i >= 0) {
		if(Range == 0.0) Temp = 1.0;
		else Temp = (Data[i+Shift] - Data[i+1+Shift])/Range;
		if(w) Df = Df + (p-1-i)*MathSqrt(Temp*Temp + 1.0/(p*p));
		else Df = Df + MathSqrt(Temp*Temp + 1.0/(p*p));
		i--;
	}
	if(w) Df = Df/(p/2.0);
	Df = 1.0 + MathLog(2.0*Df)/MathLog(2.0*p);

	return(Df);
}
//+------------------------------------------------------------------+
int start() {
	int j = 0;
	int i = IndicatorCounted();
	if(i < 0) return(-1);
	i = Bars - i;
	if(i > MaxBars) {
		i = MaxBars;
		ArrayInitialize(TrendBuffer, 1.5);
		ArrayInitialize(RangeBuffer, 1.5);
		ArrayInitialize(dFDIBuffer, 1.7);
		i--;
		j = i + WindowSize;
	}
	else j = i;

	while(j >= 0) {
		Price[j] = iMA(NULL, 0, 1, 0, 0, AppliedPrice, j+PriceShift);
		dPrice[j] = Price[j] - iMA(NULL, 0, 1, 0, 0, AppliedPrice, j+PriceShift+1);
		j--;
	}

	while(i >= 0) {
		double Df = FDI(Price, WindowSize, LinearWeighted, i);

		if(RangeBuffer[i+1] == EMPTY_VALUE) Df = (1.0-Alpha)*TrendBuffer[i+1] + Alpha*Df;
		else Df = (1.0-Alpha)*RangeBuffer[i+1] + Alpha*Df;

		if(dFDI) dFDIBuffer[i] = (1.0-Alpha)*dFDIBuffer[i+1] + Alpha*FDI(dPrice, WindowSize, LinearWeighted, i);
		else dFDIBuffer[i] = EMPTY_VALUE;

		if(Df > RandomLevel) {
			RangeBuffer[i] = Df;
			TrendBuffer[i] = EMPTY_VALUE;
			if(RangeBuffer[i+1] == EMPTY_VALUE) RangeBuffer[i+1] = TrendBuffer[i+1];
		} else {
			TrendBuffer[i] = Df;
			RangeBuffer[i] = EMPTY_VALUE;
			if(TrendBuffer[i+1] == EMPTY_VALUE) TrendBuffer[i+1] = RangeBuffer[i+1];
		}
		i--;
	}

   	return(0);
}
//+------------------------------------------------------------------+
Comments