LSMA in Color31_v1
Download script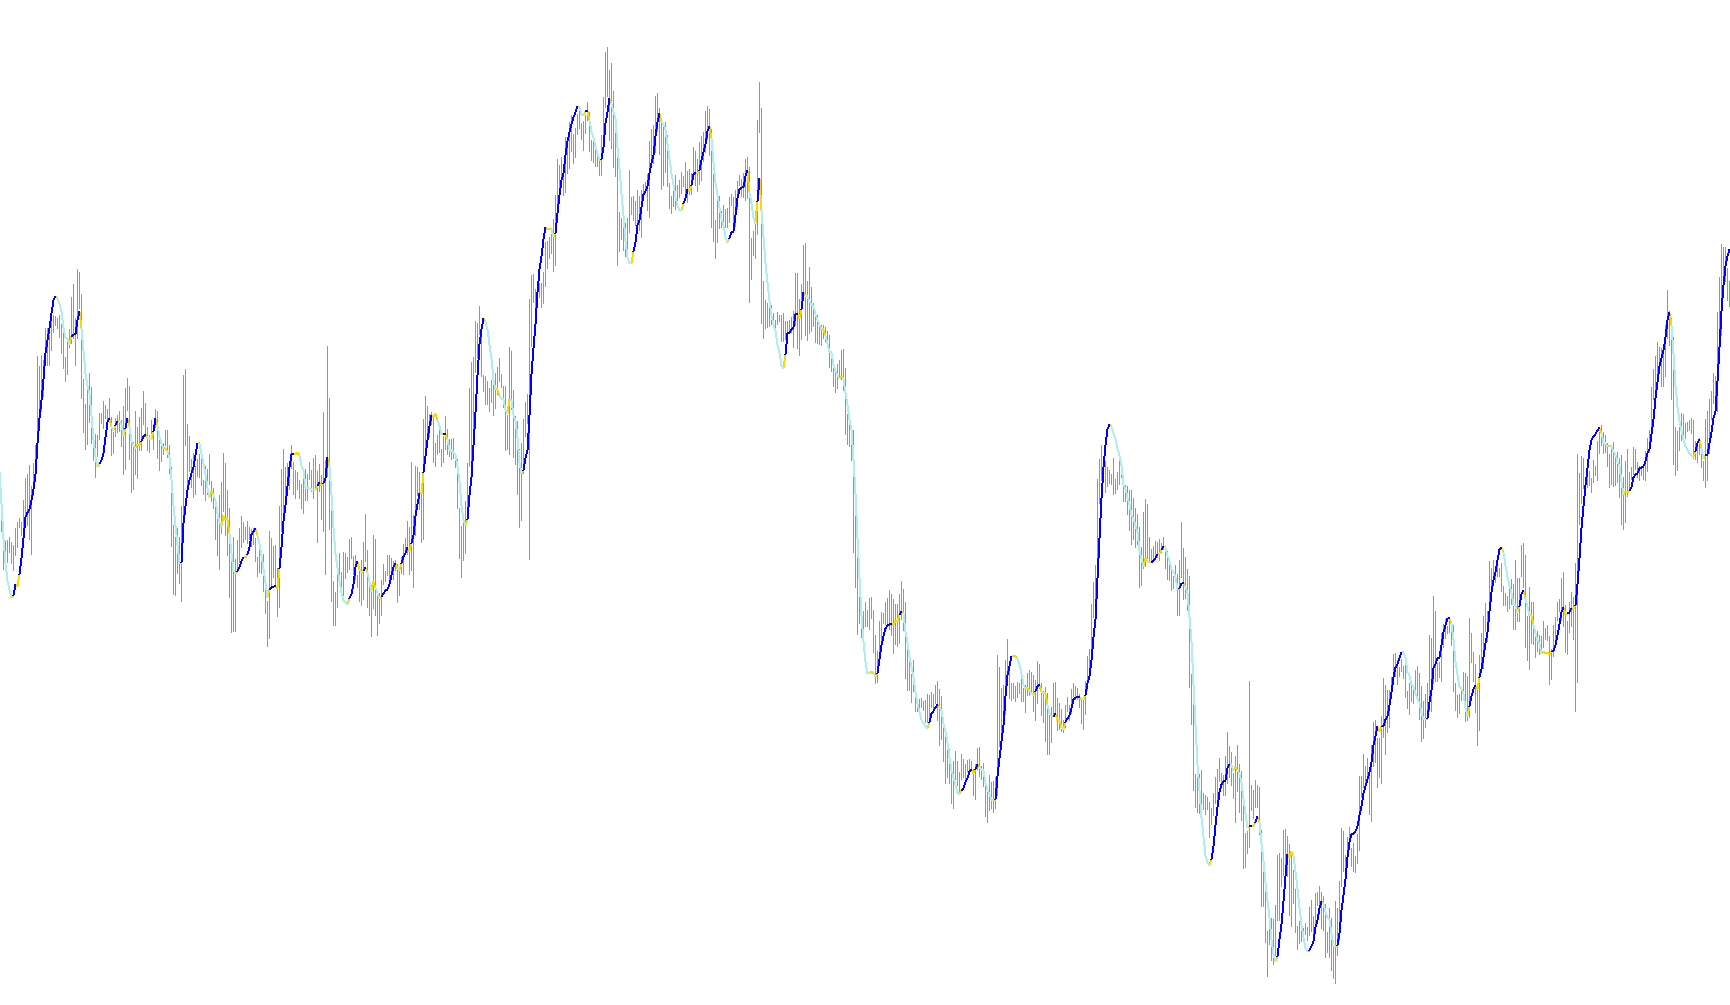
This tool is designed to provide a visual representation of price trends on your trading chart by using a modified smoothing calculation. Instead of just showing a standard moving average, it focuses on the momentum and direction of the market to help traders identify whether the current trend is shifting upward or downward in real-time.
Core Functionality
The script calculates a specific weighted value based on a user-defined period (the number of previous price candles analyzed). Unlike basic indicators that give equal importance to all past data, this logic applies different weights to the price history, making it more sensitive to recent price actions while still maintaining a smooth visual curve.
Visual Logic and Color Coding
The most unique feature of this script is its dynamic color-changing behavior. It uses three distinct colors—Yellow, Green, and Red—to communicate trend direction directly on your screen:
- Trend Movement: The script constantly compares the current weighted value against the previous one.
- Directional Cues: By checking if the value is increasing or decreasing, the indicator automatically toggles which color is displayed at any given moment.
- Clean Visualization: When the trend direction changes, the script "cleans" the previous state by hiding specific colors and only highlighting the active trend. This ensures that the chart remains readable and clearly shows you exactly where the momentum is heading without unnecessary clutter.
How to Interpret the Results
As a trader, you can use this tool to quickly assess market sentiment. When the line changes color, it signifies a shift in the mathematical momentum of the price.
- A shift in color serves as a visual signal that the "weight" of recent price action has tipped in a new direction.
- This allows you to see at a glance whether the current trend is gaining strength, losing steam, or reversing, helping you stay aligned with the prevailing market flow.
/*-----------------------------+
|			       |
| Shared by www.Aptrafx.com    |
|			       |
+------------------------------*/

//+------------------------------------------------------------------+
//|                                               LSMA in Color3.mq4 |
//|                      Copyright © 2004, MetaQuotes Software Corp. |
//|                                       http://www.metaquotes.net/ |
//+------------------------------------------------------------------+
#property  copyright "Copyright © 2005, FX Sniper "
#property  link      "http://www.metaquotes.net/"

//---- indicator settings
#property  indicator_chart_window
#property  indicator_buffers 3
#property indicator_color1 Yellow
#property indicator_color2 Green
#property indicator_color3 Red

//---- buffers
double ExtMapBuffer1[];
double ExtMapBuffer2[];
double ExtMapBuffer3[];
int width;

extern int Rperiod = 14;
extern int Draw4HowLongg = 1500;
int Draw4HowLong;
int shift;
int i;
int loopbegin;
double sum[];
int length;
double lengthvar;
double tmp ;
double wt[];
int c;

//+------------------------------------------------------------------+
//| Custom indicator initialization function                         |
//+------------------------------------------------------------------+
int init()
  {
//---- 2 additional buffers are used for counting.
   IndicatorBuffers(5);

//---- drawing settings
   SetIndexBuffer(2,ExtMapBuffer1);
   SetIndexBuffer(1,ExtMapBuffer2);
   SetIndexBuffer(0,ExtMapBuffer3);
   SetIndexBuffer(3,sum);
   SetIndexBuffer(4,wt);

   SetIndexStyle(2,DRAW_LINE,STYLE_SOLID,2);
   SetIndexStyle(1,DRAW_LINE,STYLE_SOLID,2);
   SetIndexStyle(0,DRAW_LINE,STYLE_SOLID,2);

//---- initialization done
   return(0);
  }

int start()

  {   Draw4HowLong = Bars-Rperiod - 5;
      length = Rperiod;
      loopbegin = Draw4HowLong - length - 1;

      for(shift = loopbegin; shift >= 0; shift--)
      {
         sum[1] = 0;
         for(i = length; i >= 1  ; i--)
         {
         lengthvar = length + 1;
         lengthvar /= 3;
         tmp = 0;
         tmp = ( i - lengthvar)*Close[length-i+shift];
         sum[1]+=tmp;
         }
         wt[shift] = sum[1]*6/(length*(length+1));

//========== COLOR CODING ===========================================

       ExtMapBuffer3[shift] = wt[shift]; //red
       ExtMapBuffer2[shift] = wt[shift]; //green
       ExtMapBuffer1[shift] = wt[shift]; //yellow

       //  for(c=loopbegin;c==shift;c++)
       // {
        if (wt[shift+1] > wt[shift])
        {
        ExtMapBuffer2[shift] = EMPTY_VALUE;
  // ObjectCreate("smiley_face", OBJ_ARROW, 0, Time[shift], Low[shift]-Point*20);
  // Print("time=  ",Time[shift]);
  // ObjectSet("smiley_face", OBJPROP_ARROWCODE, 242);
  // ObjectSet("smiley_face", OBJPROP_COLOR , Red);
  // ObjectSet("smiley_face", OBJPROP_WIDTH  , 1);
  // ObjectsRedraw();

        //ExtMapBuffer3[shift+1] = EMPTY_VALUE;
        //ExtMapBuffer3[shift+1] = EMPTY_VALUE;

        }
       else if (wt[shift+1] < wt[shift])
        {
        ExtMapBuffer1[shift] = EMPTY_VALUE; //-1 red/greem tight
       //ExtMapBuffer3[shift+1] = EMPTY_VALUE;

        }
         else
         {

         ExtMapBuffer1[shift]=EMPTY_VALUE;//EMPTY_VALUE;
         ExtMapBuffer2[shift]=EMPTY_VALUE;//EMPTY_VALUE;
         }

      }

      return(0);
  }
//+------------------------------------------------------------------+
Comments