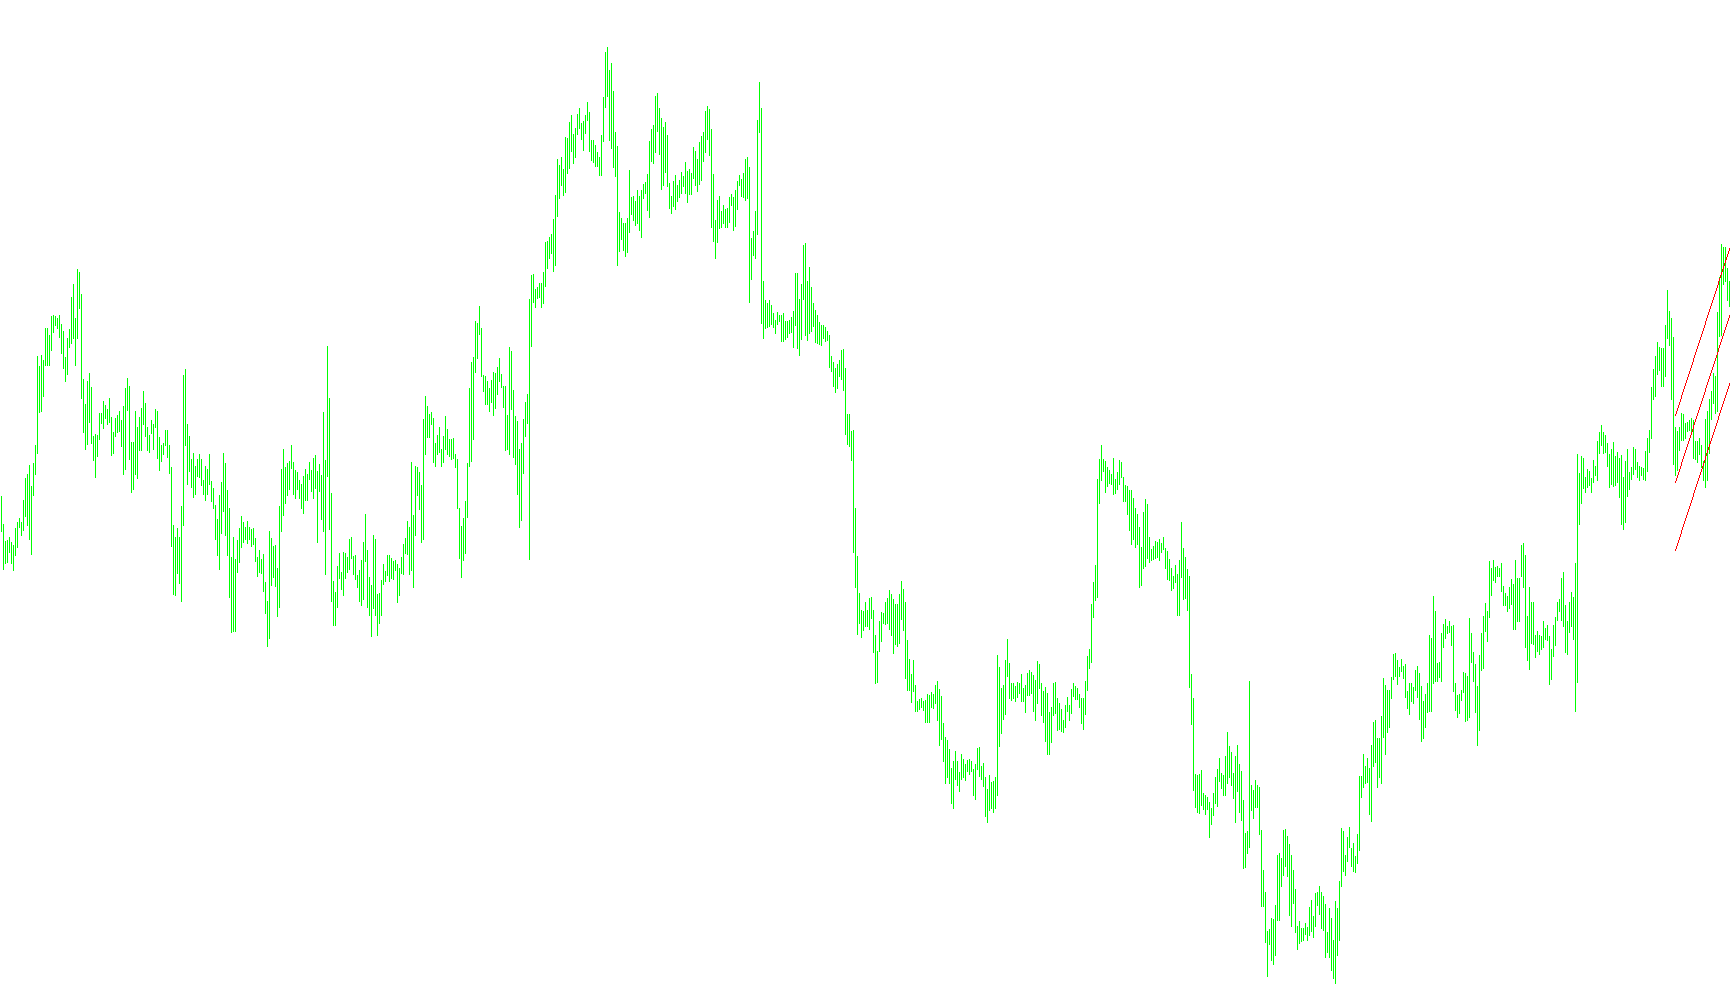
This script is designed to provide a visual "Auto Regression Channel" on your trading chart. Instead of just showing you where the price has been, it uses mathematical modeling to project a trend corridor, helping traders identify the underlying direction and volatility of the market.
Core Functionality
The tool operates by analyzing a specific window of past price data—defined by the "RPeriod" setting—to calculate a linear regression. In simple terms, it looks at the most recent history and draws a "best-fit" straight line that represents the overall trajectory of the asset's movement.
How the Logic Works
1. Data Selection The script allows you to choose which specific price point to analyze: the Closing price, the Low, or the High. Based on your selection, it gathers data from the most recent bars to begin its calculations.
2. Trend Line Calculation (The Center) By calculating the relationship between time and price, the script determines a mathematical slope. This results in a central trend line (the "Reg_line"). This line acts as the equilibrium of the current trend, showing you the general path the price is following.
3. Volatility Measurement (Standard Deviation) The script doesn't just draw a single line; it also measures how much the price fluctuates around that center line. It calculates a "Standard Deviation," which represents the market's volatility. If the price is swinging wildly, the channel will be wider; if the price is moving steadily, the channel will be narrower.
4. Channel Construction (Upper and Lower Boundaries) Using the volatility measurement, the script creates two outer boundaries:
- Upper Bound: This is calculated by adding a specific multiplier (the "StDev" value) to the center line.
- Lower Bound: This is calculated by subtracting that same value from the center line.
Visual Output on Your Chart
When you apply this script, it automatically draws three distinct lines on your chart:
- The Center Line: Represents the primary trend direction.
- The Upper Boundary: Acts as a potential resistance area where the price might overextend relative to its average trend.
- The Lower Boundary: Acts as a potential support area where the price might be considered "oversold" relative to its average trend.
By observing how the price interacts with this channel, you can get a clearer sense of whether the market is trending strongly, consolidating, or potentially reaching an extreme point in its current movement.
//+------------------------------------------------------------------+
//|                                                    LSMA_Line.mq4 |
//|                      Copyright © 2005, MetaQuotes Software Corp. |
//|                                       http://www.metaquotes.net/ |
//+------------------------------------------------------------------+
#property copyright "Copyright © 2005, MetaQuotes Software Corp."
#property link      "http://www.metaquotes.net/"

#property indicator_chart_window
//---- indicator parameters
extern int    IdNum   = 1;
extern int    RPeriod = 28;
extern color  LineColor = Red;
extern int    LineWeight   = 1;
extern int    PriceVal = 0;         // 0 = Close, 1 = Low, 2 = High
extern double StDev = 1.618;

//+------------------------------------------------------------------+
//| Custom indicator initialization function                         |
//+------------------------------------------------------------------+
int init()
  {
//----
  ObjectCreate("Reg_line"+IdNum, OBJ_TREND, 0, 0,0, 0,0);
	ObjectSet("Reg_line"+IdNum, OBJPROP_COLOR, LineColor);
 	ObjectSet("Reg_line"+IdNum, OBJPROP_STYLE, STYLE_SOLID);
 	ObjectSet("Reg_line"+IdNum, OBJPROP_WIDTH, LineWeight);
  ObjectCreate("Reg_upper" +IdNum, OBJ_TREND, 0, 0,0, 0,0);
	ObjectSet("Reg_upper"+IdNum, OBJPROP_COLOR, LineColor);
 	ObjectSet("Reg_upper"+IdNum, OBJPROP_STYLE, STYLE_SOLID);
 	ObjectSet("Reg_upper"+IdNum, OBJPROP_WIDTH, LineWeight);
  ObjectCreate("Reg_lower" +IdNum, OBJ_TREND, 0, 0,0, 0,0);
 	ObjectSet("Reg_lower"+IdNum, OBJPROP_COLOR, LineColor);
 	ObjectSet("Reg_lower"+IdNum, OBJPROP_STYLE, STYLE_SOLID);
 	ObjectSet("Reg_lower"+IdNum, OBJPROP_WIDTH, LineWeight);

  Comment("Auto Regression channel");
   return(0);
  }

//+------------------------------------------------------------------+
//| Custor indicator deinitialization function                       |
//+------------------------------------------------------------------+
void deinit() {
  ObjectDelete("Reg_line"+IdNum);
  ObjectDelete("Reg_upper" +IdNum);
  ObjectDelete("Reg_lower" +IdNum);
  Comment("");
}

//+------------------------------------------------------------------+
//| Regression Line                                                  |
//+------------------------------------------------------------------+
int start()
  {
   double y1,y2, price;
   double a1, a2, a3, b1, a, b;
   double stddiv, tmp_div;
   double x_n_up, x_1_up, x_n_down, x_1_down;
   int shift, n;

//----
   if(Bars<=RPeriod) return(0);
   a1 = 0;
   a2 = 0;
   a3 = 0;
   b1 = 0;
   a = 0;
   b = 0;
   y1 = 0;
   y2 = 0;
   tmp_div = 0;
   n = RPeriod;
  	for(shift=RPeriod;shift>0;shift--)
  	{
  	  switch (PriceVal)
  	  {
  	     case 0: price = Close[shift];
  	             break;
  	     case 1: price = Low[shift];
  	             break;
  	     case 2: price = High[shift];
  	             break;
  	  }
     a1 = a1 + shift*price;
     a2 = a2 + shift;
     a3 = a3 + price;
     b1 = b1 + shift*shift;
  }

  b = (n*a1 - a2*a3)/(n*b1 - a2*a2);
  a = (a3 - b*a2)/n;
  y1 = a + b*n;
  y2 = a + b;

 	ObjectSet("Reg_line"+IdNum, OBJPROP_TIME1, Time[RPeriod]);
 	ObjectSet("Reg_line"+IdNum, OBJPROP_TIME2, Time[0]);
 	ObjectSet("Reg_line"+IdNum, OBJPROP_PRICE1, y1);
 	ObjectSet("Reg_line"+IdNum, OBJPROP_PRICE2, y2);

  for (shift=RPeriod; shift>0; shift--) {
  	  switch (PriceVal)
  	  {
  	     case 0: price = Close[shift];
  	             break;
  	     case 1: price = Low[shift];
  	             break;
  	     case 2: price = High[shift];
  	             break;
  	  }

  	tmp_div = tmp_div + (price - (a + b*shift))*(price - (a + b*shift));
  }

  stddiv = MathSqrt(tmp_div/n);

  x_n_up = y1 + StDev*stddiv;
  x_1_up = y2 + StDev*stddiv;

  x_n_down = y1 - StDev*stddiv;
  x_1_down = y2 - StDev*stddiv;


  //upper
 	ObjectSet("Reg_upper"+IdNum, OBJPROP_TIME1, Time[RPeriod]);
 	ObjectSet("Reg_upper"+IdNum, OBJPROP_TIME2, Time[0]);
 	ObjectSet("Reg_upper"+IdNum, OBJPROP_PRICE1, x_n_up);
 	ObjectSet("Reg_upper"+IdNum, OBJPROP_PRICE2, x_1_up);
  //lower
 	ObjectSet("Reg_lower"+IdNum, OBJPROP_TIME1, Time[RPeriod]);
 	ObjectSet("Reg_lower"+IdNum, OBJPROP_TIME2, Time[0]);
 	ObjectSet("Reg_lower"+IdNum, OBJPROP_PRICE1, x_n_down);
 	ObjectSet("Reg_lower"+IdNum, OBJPROP_PRICE2, x_1_down);

   return(0);
  }
//+------------------------------------------------------------------+
Comments