MA Chanels
Download script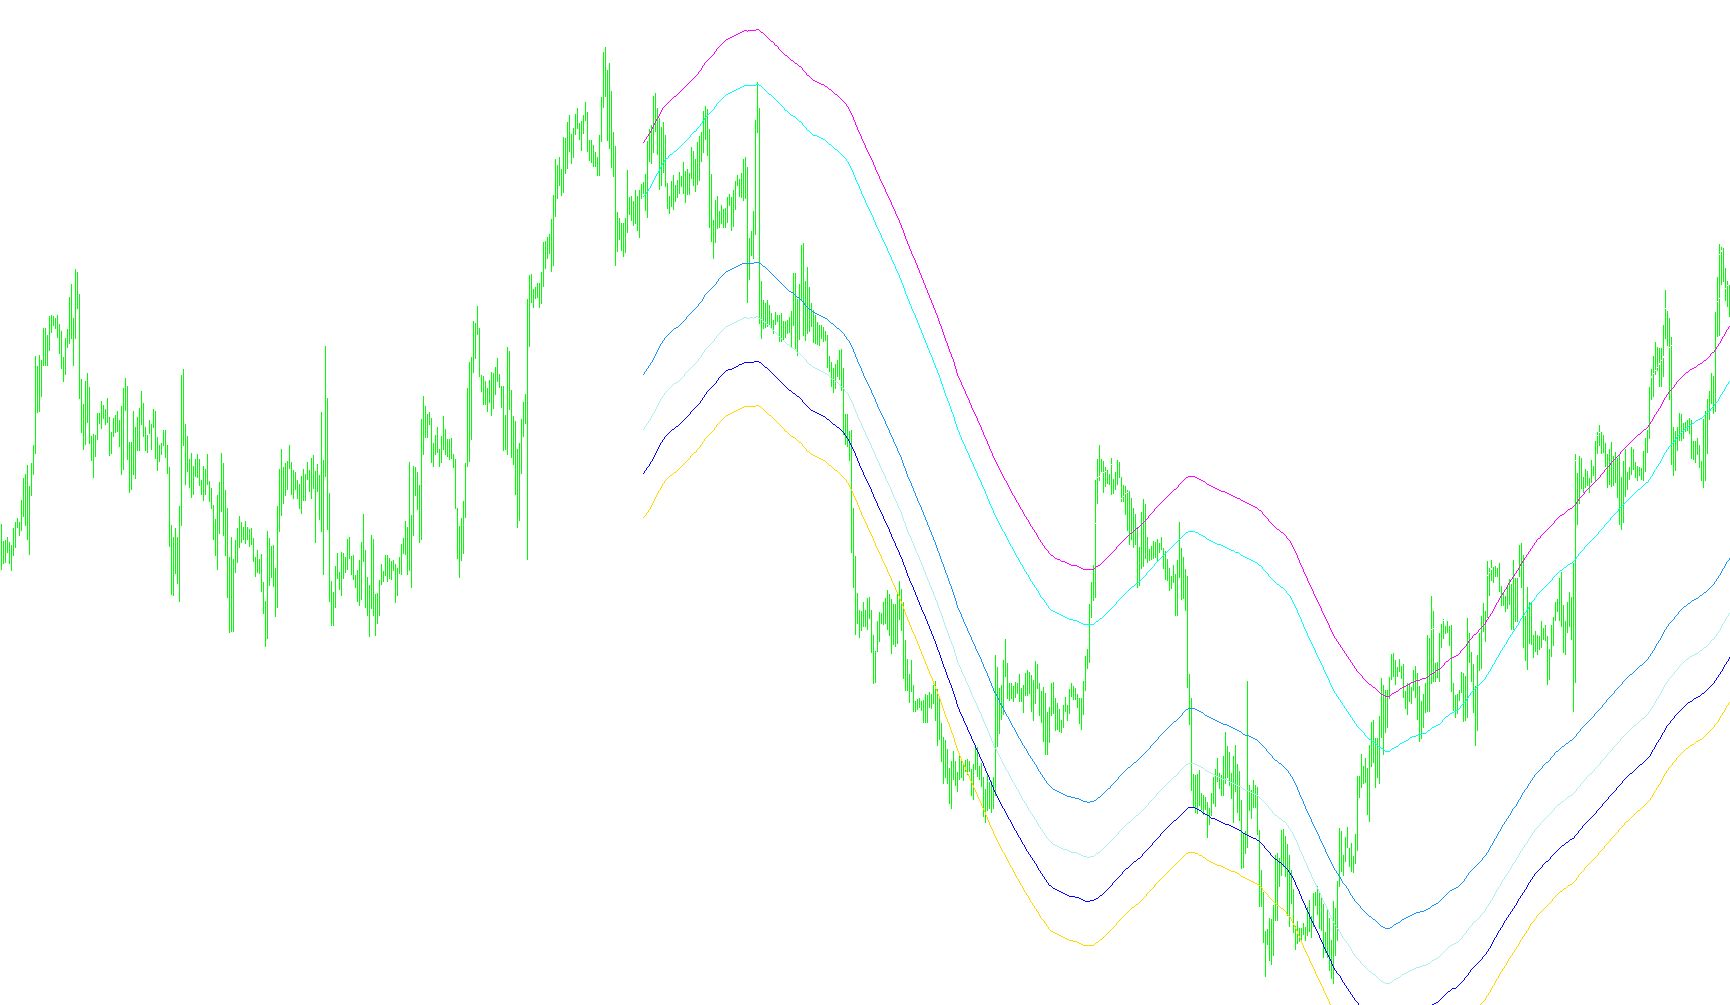
This script functions as a dynamic visual tool designed to help traders identify potential support and resistance zones based on price volatility relative to a moving average. Rather than using static horizontal lines, it creates a "channel" of boundaries that adjust automatically as the market moves.
Core Logic Overview
The script operates by analyzing the relationship between the current market price and a Simple Moving Average (SMA). It breaks down its logic into three primary phases:
1. Data Scanning and Range Detection The tool first looks back at a specific number of historical bars (determined by the user's settings) to understand the recent "swing" of the market. It calculates how far the price has moved above and below the Moving Average during this period. By identifying the highest peak and the lowest trough relative to that average, the script establishes the total "volatility range" for that specific timeframe.
2. Fibonacci Scaling Once the maximum volatility range is identified, the script applies a series of mathematical multipliers based on the Fibonacci sequence. Specifically, it uses key ratios—such as 0.236, 0.382, 0.5, and 0.618—to divide that volatility range into proportional segments. This allows the tool to project balanced levels of potential market reaction points both above and below the moving average.
3. Dynamic Channel Plotting Finally, the script draws eight distinct lines on your chart. These lines are anchored to the Moving Average but are offset by the Fibonacci percentages calculated in the previous step.
- Four lines project upward, representing potential resistance levels.
- Four lines project downward, representing potential support levels.
How it appears on your chart
Instead of seeing just one price line, you will see a multi-layered "envelope" or "channel." As the Moving Average moves, these eight lines move with it, expanding or contracting based on how much the price has recently fluctuated. This provides a visual map of where price might find balance, helping traders visualize the "boundaries" of current market behavior.
//+------------------------------------------------------------------+
//|                                                   MA Chanels.mq4 |
//|                                                           °njel° |
//|                                                     iamnotlinked |
//+------------------------------------------------------------------+
#property copyright "°njel°"
#property link      "iamnotlinked"

#property indicator_chart_window
#property indicator_buffers 8

#property indicator_color1 Red
#property indicator_color2 Orange
#property indicator_color3 Yellow
#property indicator_color4 White
#property indicator_color5 White
#property indicator_color6 Yellow
#property indicator_color7 Orange
#property indicator_color8 Red
//---- input parameters
extern int BarsCount = 500;
extern int       MAPeriod=100;

double  max =0;
double  min =0;

double    Inc0 = 0.0000;
double    Inc1 = 0.0000;
double    Inc2 = 0.0000;
double    Inc3 = 0.0000;
//---- buffers
double ExtMapBuffer1[];
double ExtMapBuffer2[];
double ExtMapBuffer3[];
double ExtMapBuffer4[];
double ExtMapBuffer5[];
double ExtMapBuffer6[];
double ExtMapBuffer7[];
double ExtMapBuffer8[];
//+------------------------------------------------------------------+
//| Custom indicator initialization function                         |
//+------------------------------------------------------------------+
int init()
  {
//---- indicators
   SetIndexStyle(0,DRAW_LINE);
   SetIndexBuffer(0,ExtMapBuffer1);
   SetIndexLabel(0,"61.8%");

   SetIndexStyle(1,DRAW_LINE);
   SetIndexBuffer(1,ExtMapBuffer2);
   SetIndexLabel(1,"50%");

   SetIndexStyle(2,DRAW_LINE);
   SetIndexBuffer(2,ExtMapBuffer3);
   SetIndexLabel(2,"38.2%");

   SetIndexStyle(3,DRAW_LINE);
   SetIndexBuffer(3,ExtMapBuffer4);
   SetIndexLabel(3,"23.5%");


   SetIndexStyle(4,DRAW_LINE);
   SetIndexBuffer(4,ExtMapBuffer5);
   SetIndexLabel(4,"23.5%");

   SetIndexStyle(5,DRAW_LINE);
   SetIndexBuffer(5,ExtMapBuffer6);
   SetIndexLabel(5,"38.2%");

   SetIndexStyle(6,DRAW_LINE);
   SetIndexBuffer(6,ExtMapBuffer7);
   SetIndexLabel(6,"50%");

   SetIndexStyle(7,DRAW_LINE);
   SetIndexBuffer(7,ExtMapBuffer8);
   SetIndexLabel(7,"61.8%");
//----
   return(0);
  }
//+------------------------------------------------------------------+
//| Custom indicator deinitialization function                       |
//+------------------------------------------------------------------+
int deinit()
  {
   max =0;
   min =0;
   return(0);
  }
//+------------------------------------------------------------------+
//| Custom indicator iteration function                              |
//+------------------------------------------------------------------+
int start()
  {


   max =0;
   min =0;


   if (iBars(NULL,0) < BarsCount)
      BarsCount = iBars(NULL,0) -MAPeriod-1 ;

   for (int i =BarsCount; i>=0; i--)
   {

      double m = iMA(NULL,0,MAPeriod,0,MODE_SMA,PRICE_CLOSE,i);
      double top = High[i] - m;
      if (top > max)
         max = top;

      double bottom = Low[i] - m;
      if (bottom < min)
         min = bottom;

   }

   if (MathAbs(max) >  MathAbs(min))
      Inc3 = max;
   else
      Inc3 = min;


      Inc2 = Inc3*0.618;
      Inc1 = Inc3*0.5;
      Inc0 = Inc3*0.236;
      Inc3 = Inc3*0.382;


   for (i =BarsCount; i>=0; i--)
   {
      ExtMapBuffer1[i] = iMA(NULL,0,MAPeriod,0,MODE_SMA,PRICE_CLOSE,i) + Inc2;
      ExtMapBuffer2[i] = iMA(NULL,0,MAPeriod,0,MODE_SMA,PRICE_CLOSE,i) + Inc1;
      ExtMapBuffer3[i] = iMA(NULL,0,MAPeriod,0,MODE_SMA,PRICE_CLOSE,i) + Inc3;
      ExtMapBuffer4[i] = iMA(NULL,0,MAPeriod,0,MODE_SMA,PRICE_CLOSE,i) + Inc0;


      ExtMapBuffer5[i] = iMA(NULL,0,MAPeriod,0,MODE_SMA,PRICE_CLOSE,i) - Inc0;
      ExtMapBuffer6[i] = iMA(NULL,0,MAPeriod,0,MODE_SMA,PRICE_CLOSE,i) - Inc3;
      ExtMapBuffer7[i] = iMA(NULL,0,MAPeriod,0,MODE_SMA,PRICE_CLOSE,i) - Inc1;
      ExtMapBuffer8[i] = iMA(NULL,0,MAPeriod,0,MODE_SMA,PRICE_CLOSE,i) - Inc2;


   }

   return(0);
  }
//+------------------------------------------------------------------+
Comments