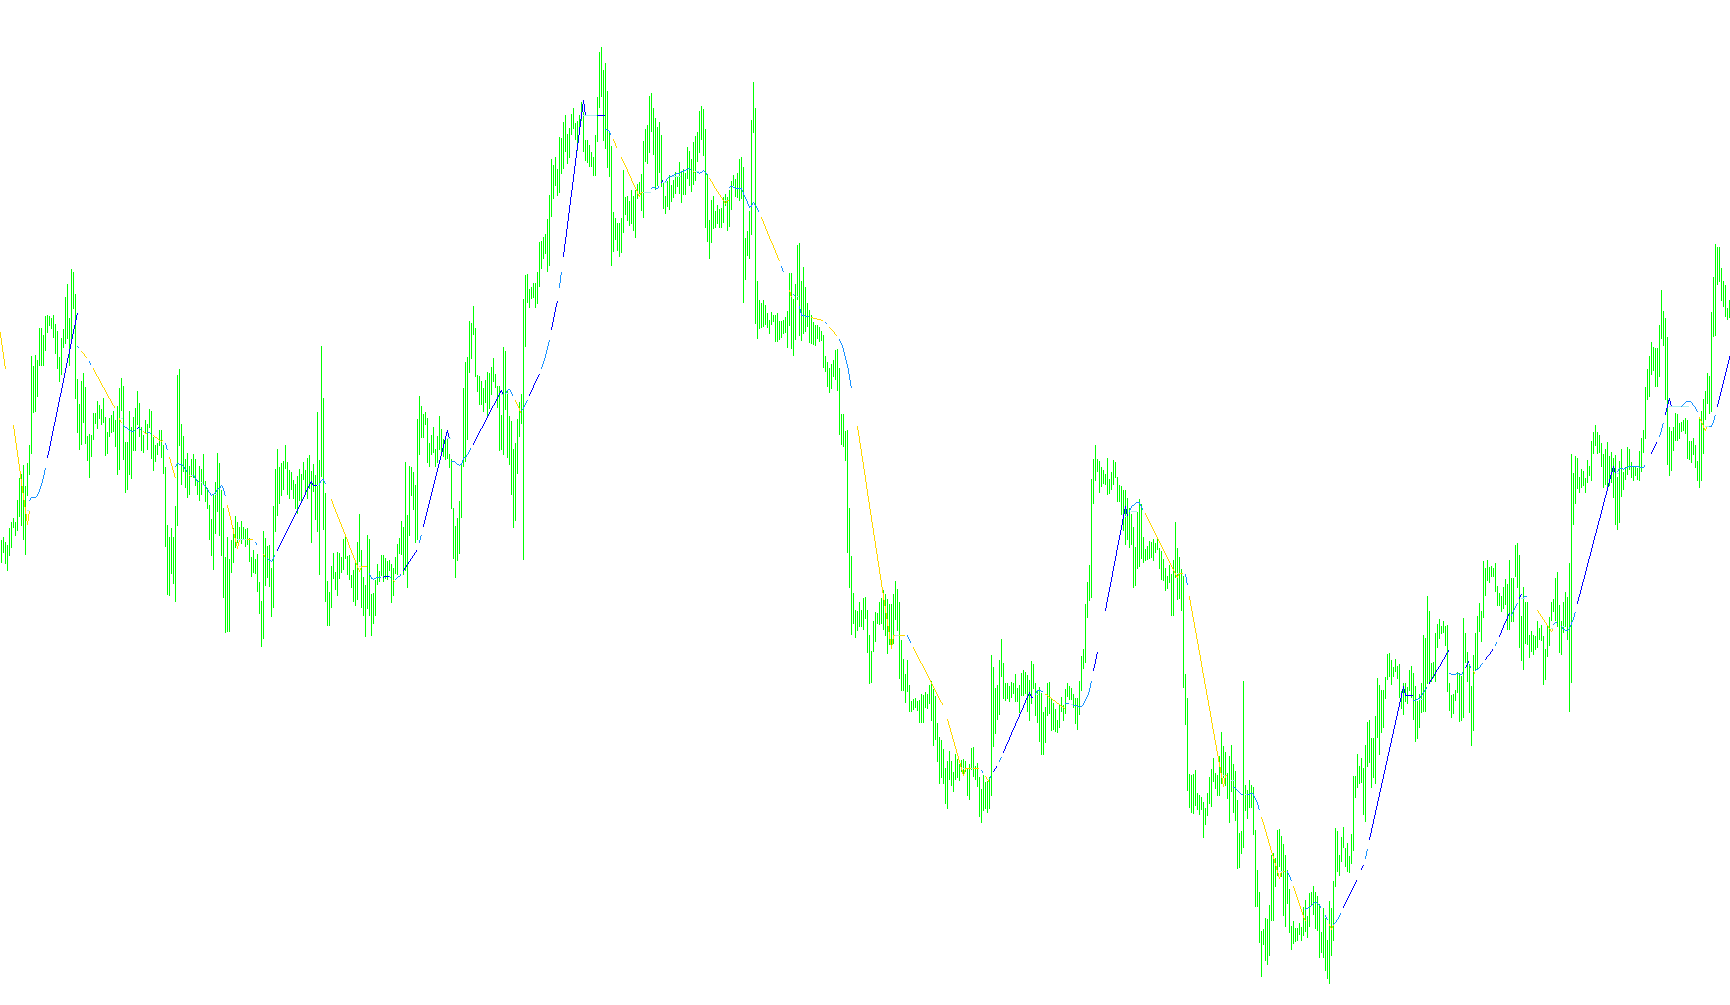
This script is designed to provide a visual analysis of price trends by creating a custom trajectory that follows, reacts to, or deviates from a Moving Average (MA). Rather than simply plotting the Moving Average itself, the logic calculates how the indicator should "behave" based on the momentum and slope of that average.
Here is the breakdown of the core logic used to generate the lines on your chart:
Core Movement Logic
The indicator monitors the behavior of the Moving Average to determine which path the visual line should take. It handles three primary scenarios:
1. Acceleration (Increasing Slope) If the Moving Average begins to move upward more steeply than it did previously (an increase in the angle of the slope), the indicator will "snap" to and follow the Moving Average directly. This highlights moments where the trend is gaining significant momentum.
2. Deceleration (Decreasing Slope) If the Moving Average continues to move in the same direction but the angle starts to flatten out (the slope is decreasing), the indicator does not follow the average perfectly. Instead, it projects a straight line forward based on the previous trajectory. This helps visualize where the trend "should" go if the current deceleration continues.
3. Trend Reversals and Price Crosses The script monitors the relationship between the current price (the closing price) and the indicator's own position:
- Horizontal Locking: If the market price crosses over the indicator line, the indicator stops its movement and stays on a perfectly horizontal level.
- Breakout Condition: It remains flat at this horizontal level until the underlying Moving Average changes direction significantly enough to "pull" the indicator back into motion.
Visual Feedback System
The script uses different colors to communicate these logical states to the user:
- White Line: Indicates that the indicator is actively following the Moving Average because of a change in momentum or acceleration.
- Red/Blue Lines: These appear when the indicator is moving along a projected straight line (the "deceleration" phase). The specific color choice helps differentiate between these types of linear projections based on the current relative position of the average.
- Yellow Line: This highlights the horizontal "locked" state, showing where the price has intersected the indicator and the logic is waiting for a trend shift to resume movement.
Summary for the User
In simple terms, this tool is designed to filter out minor "noise" in the Moving Average. It tries to show you the "path of least resistance": it follows the trend when it's strong, projects the current path when it's weakening, and stays flat when price action creates a specific intersection point. This allows a trader to see whether a trend is actively accelerating, fading, or being blocked by current price levels.
//+------------------------------------------------------------------+
//|                                              dex_Angle_MA_v3.mq4 |
//|                                                        GrayMan77 |
//|                                                                  |
//|  Èäåÿ - Akadex.                                                  |
//|                                                                  |
//|  Ïîñòðîåíèå íåêîåãî ïîäîáèÿ ñðåäíåé ïî ñïåöèàëüíûì óñëîâèÿì      |
//|  (íà ïðèìåðå äâèæåíèÿ ñðåäíåé ââåðõ):                            |
//|  - åñëè óãîë íàêëîíà ñðåäíåé óâåëè÷èâàåòñÿ - èíäèêàòîð èäåò      |
//|    çà ñðåäíåé;                                                   |
//|  - åñëè óãîë íàêëîíà ñðåäíåé óìåíüøàåòñÿ - èíäèêàòîð èäåò ïî     |
//|    ïðÿìîé ñ òàêèì æå íàêëîíîì, êàê áûë ðàíåå ó ñðåäíåé;          |
//|  - åñëè öåíà (Close) ïåðåñåêàåò ëèíèþ èíäèêàòîðà, èíäèêàòîð äàëåå|
//|    èäåò ïî ãðîðèçîíòàëüíîé ïðÿìîé äî òåõ ïîð, ïîêà íàêëîí ñðåäíåé|
//|     íå èçìåíèòñÿ íà ïðîòèâîïîëîæíûé (âíèç)                       |
//|                                                                  |
//|  Ïîñòðîåíèå èíäèêàòîðà ïðè äâèæåíèè ñðåäíåé âíèç: ïðîòèâîïîëîæíûå|
//|  óñëîâèÿ.                                                        |
//|                                                                  |
//|  v3 - èçìåíåí àëãîðèòì.                                          |
//|  |
//+------------------------------------------------------------------+
#property copyright "Akadex & GrayMan77"
#property link      ""

#property indicator_chart_window
#property indicator_buffers 4
#property indicator_color1 Red
#property indicator_color2 Aqua
#property indicator_color3 Yellow
#property indicator_color4 White

//---- input parameters
extern int       MA_Period=24;
extern int       MA_Method=0;
extern int       MA_Price=0;


//---- buffers
double ExtMapBuffer1[];

double red[],blue[],yellow[],white[];

//+------------------------------------------------------------------+
//| Custom indicator initialization function                         |
//+------------------------------------------------------------------+
int init()
  {
//---- indicators
   IndicatorBuffers(5);
   SetIndexStyle(0,DRAW_LINE);
   SetIndexBuffer(0,red);
   SetIndexStyle(1,DRAW_LINE);
   SetIndexBuffer(1,blue);
   SetIndexStyle(2,DRAW_LINE);
   SetIndexBuffer(2,yellow);

   SetIndexStyle(3,DRAW_LINE);
   SetIndexBuffer(3,white);

   SetIndexStyle(4,DRAW_LINE);
   SetIndexBuffer(4,ExtMapBuffer1);
//----
   return(0);
  }
//+------------------------------------------------------------------+
//| Custom indicator deinitialization function                       |
//+------------------------------------------------------------------+
int deinit()
  {
//----

//----
   return(0);
  }
//+------------------------------------------------------------------+
//| Custom indicator iteration function                              |
//+------------------------------------------------------------------+
int start()
  {
  int limit,i;
  int    counted_bars=IndicatorCounted();
  double MA,MA1,MA2,MA3;
  double delta,delta1,delta2;
  double Line;
//----

  //---- ïðîâåðêà íà âîçìîæíûå îøèáêè
   if(counted_bars<0) return(-1);

   //---- ïîñëåäíèé ïîñ÷èòàííûé áàð áóäåò ïåðåñ÷èòàí
   if(counted_bars>0) counted_bars--;
   limit=Bars-counted_bars;
   if(limit>Bars-MA_Period)
     {
     limit=Bars-MA_Period-3;
     ExtMapBuffer1[Bars-MA_Period]=iMA(NULL,0,MA_Period,0,MA_Method,MA_Price,Bars-MA_Period);
     ExtMapBuffer1[Bars-MA_Period-1]=iMA(NULL,0,MA_Period,0,MA_Method,MA_Price,Bars-MA_Period-1);
     ExtMapBuffer1[Bars-MA_Period-2]=iMA(NULL,0,MA_Period,0,MA_Method,MA_Price,Bars-MA_Period-2);
     }

   for(i=limit;i>=0;i--)
     {
     MA=iMA(NULL,0,MA_Period,0,MA_Method,MA_Price,i);
     MA1=iMA(NULL,0,MA_Period,0,MA_Method,MA_Price,i+1);
     MA2=iMA(NULL,0,MA_Period,0,MA_Method,MA_Price,i+2);
     //MA3=iMA(NULL,0,MA_Period,0,MA_Method,MA_Price,i+3);

     delta=MA-MA1;
     delta1=MA1-MA2;
     //delta2=MA2-MA3;

     // Ýêñòðåìóì ÌÀ (ìàêñèìóì èëè ìèíèìóì) - âîçâðàøàåì èíäèêàòîð íà ÌÀ
     if((delta>0 && delta1<=0) || (delta<0 && delta1>=0))
       {
       ExtMapBuffer1[i]=MA;
       ExtMapBuffer1[i+1]=MA1;  // ÇÄÅÑÜ ÂÎÇÌÎÆÍÀ ÏÅÐÅÐÈÑÎÂÊÀ (ÍÀ 1-Ì ÁÀÐÅ) !!!!!
                white[i]=MA;
                white[i+1]=MA1;

       continue;
       }

     // Âû÷èñëèòü çíà÷åíèå êàñàòåëüíîé ê èíäèêàòîðó
     Line=2*ExtMapBuffer1[i+1]-ExtMapBuffer1[i+2];
     //Line=2*MA1-MA2;

     // Äâèæåíèå ÌÀ ââåðõ
     if(delta>=0)
       {
       if(MA>Line)
       {ExtMapBuffer1[i]=MA;  // èäåì ïî ÌÀ
        white[i]=MA;
       }
        else
         {
         // åñëè 2 áàðà íàçàä èíäèêàòîð áû íèæå ñðåäíåé
         if(ExtMapBuffer1[i+2]<MA2)
         {ExtMapBuffer1[i]=MA;  // èäåì ïî ÌÀ
                  white[i]=MA;
         }
          else
          {ExtMapBuffer1[i]=2.*ExtMapBuffer1[i+1]-ExtMapBuffer1[i+2];  // èäåì ïî íàêëîííîé ïðÿìîé
          if(MA1>=MA) red[i]=ExtMapBuffer1[i]; else blue[i]=ExtMapBuffer1[i];

          }
         }

       // Ïåðåñå÷åíèå ñ öåíîé
       if(Close[i+1]<ExtMapBuffer1[i+1])
       {ExtMapBuffer1[i]=ExtMapBuffer1[i+1];  // íà÷èíàåì ãîðèçîíòàëüíóþ ëèíèþ
       yellow[i]=ExtMapBuffer1[i];
       }
       }

     // Äâèæåíèå ÌÀ âíèç
     if(delta<0)
       {
       if(MA<Line) {ExtMapBuffer1[i]=MA;  // èäåì ïî ÌÀ
                  white[i]=MA;
                  }
        else
         {
         // åñëè 2 áàðà íàçàä èíäèêàòîð áû âûøå ñðåäíåé
         if(ExtMapBuffer1[i+2]>MA2)
         {ExtMapBuffer1[i]=MA;  // èäåì ïî ÌÀ
                  white[i]=MA;
         }
          else {ExtMapBuffer1[i]=2.*ExtMapBuffer1[i+1]-ExtMapBuffer1[i+2];  // èäåì ïî íàêëîííîé ïðÿìîé
         if(MA1>=MA) red[i]=ExtMapBuffer1[i]; else blue[i]=ExtMapBuffer1[i];
         }
         }

       // Ïåðåñå÷åíèå ñ öåíîé
       if(Close[i+1]>ExtMapBuffer1[i+1])
       {ExtMapBuffer1[i]=ExtMapBuffer1[i+1];  // íà÷èíàåì ãîðèçîíòàëüíóþ ëèíèþ
       yellow[i]=ExtMapBuffer1[i];
       }
       }

     }


//----
  return(0);
  }
//+------------------------------------------------------------------+
Comments