MA dots_v1
Download script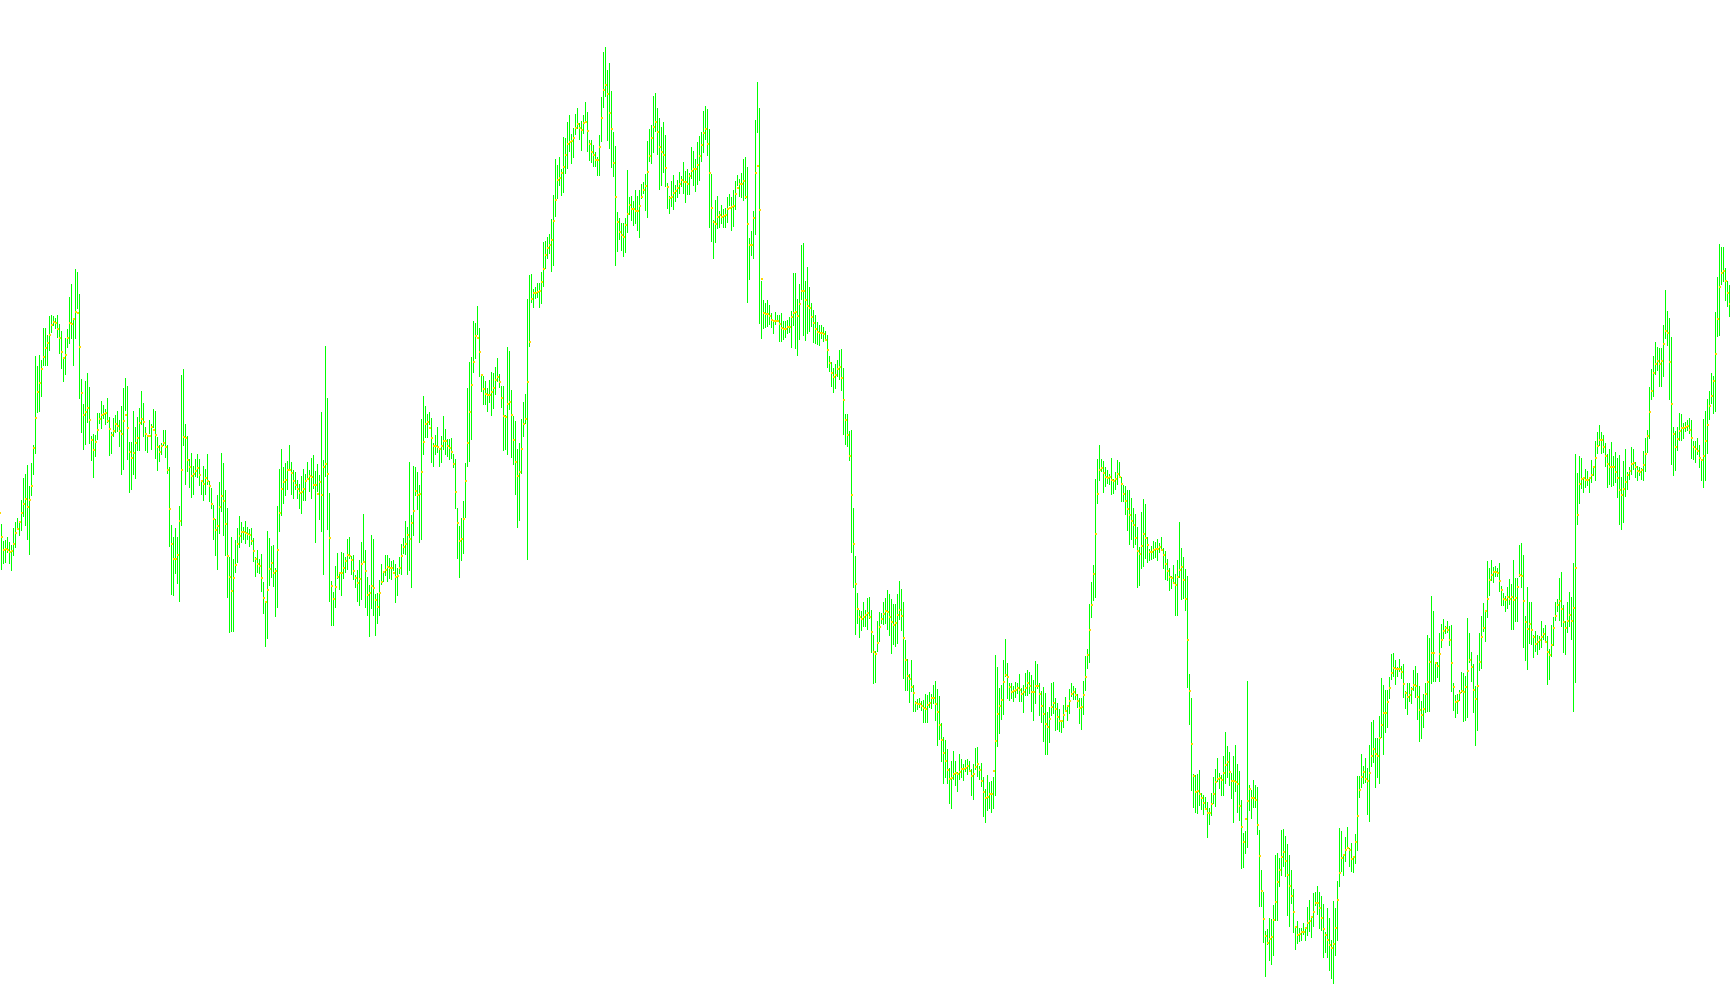
This tool is designed as a visual aid for traders using the ZoneJemputan(TM) system. Its primary purpose is to transform a standard Moving Average—a common technical analysis tool used to identify price trends—into a cleaner, more streamlined visual format on your trading chart.
How it Works
Instead of displaying a continuous, solid line that can sometimes clutter the screen or make it difficult to see other price action details, this script calculates the Moving Average values and plots them as individual dots.
Key Features & Logic
- Custom Visual Representation: The script takes the mathematical data of a Simple Moving Average (SMA) and translates it into a series of dots. This allows you to track the trend's direction and momentum while maintaining a minimalist aesthetic.
- User-Adjustable Sensitivity: The tool includes a specific parameter (length) that allows you to define how many previous data points the indicator should consider. By adjusting this, you can decide whether you want the dots to react quickly to price changes or provide a smoother, long-term trend overview.
- Median Price Calculation: The logic specifically looks at the "Median Price" (the midpoint between the highest and lowest prices of a candle). This ensures that the dots represent a balanced view of the market's movement during each period, rather than being skewed by extreme spikes or outliers.
- Seamless Integration: It is built to run in the background of your chart window, updating automatically as new price data arrives, ensuring that the visual "dots" stay perfectly aligned with the current market movements.
Summary for the Trader
Think of this script as a "visual filter." It extracts the core trend information from the market and presents it to you in a refined, dot-based format. This helps keep your charts organized and easy to read, providing a clear view of the price average without the visual noise of traditional heavy lines.
/*-----------------------------+
|			       |
| Shared by www.Aptrafx.com    |
|			       |
+------------------------------*/

// To be used with the ZoneJemputan(TM)
#property copyright "MA plotted as dots"
#property link      "http://darmasdt.com/"

#property indicator_chart_window
#property indicator_buffers 1
#property indicator_color1 White

//---- input parameters
extern int panjang= 3;


//---- buffers
double titik[];

//---- variables

//+------------------------------------------------------------------+
//| Custom indicator initialization function                         |
//+------------------------------------------------------------------+
int init()
{
   //IndicatorDigits(MarketInfo(Symbol(),MODE_DIGITS)+1);
   //---- indicators
   SetIndexStyle(0,DRAW_ARROW);
   SetIndexArrow(0,158);
   SetIndexBuffer(0,titik);
   SetIndexEmptyValue(0,0.0);

   IndicatorShortName("Darma:: MA in DOT");


   return(0);
}
//+------------------------------------------------------------------+
//| Custor indicator deinitialization function                       |
//+------------------------------------------------------------------+
int deinit()
{
   //----

   //----
   return(0);
}
//+------------------------------------------------------------------+
//| Custom indicator iteration function                              |
//+------------------------------------------------------------------+
int start()
{
   int limit;

   //int signal = MathRound(signal_day*1440/Period());

   int counted_bars = IndicatorCounted();
   //---- check for possible errors
   if (counted_bars<0) return(-1);
   //---- last counted bar will be recounted
   if (counted_bars>0) counted_bars--;
   limit = Bars - counted_bars;

   for(int i=limit; i>=0; i--)
   {

      double bahan = iMA(NULL,0,panjang,0,MODE_SMA,PRICE_MEDIAN,i);
      titik[i]=bahan;

   }

   //----
   return(0);
}
//+------------------------------------------------------------------+
Comments