MACD_3_DEMA_v101
Download script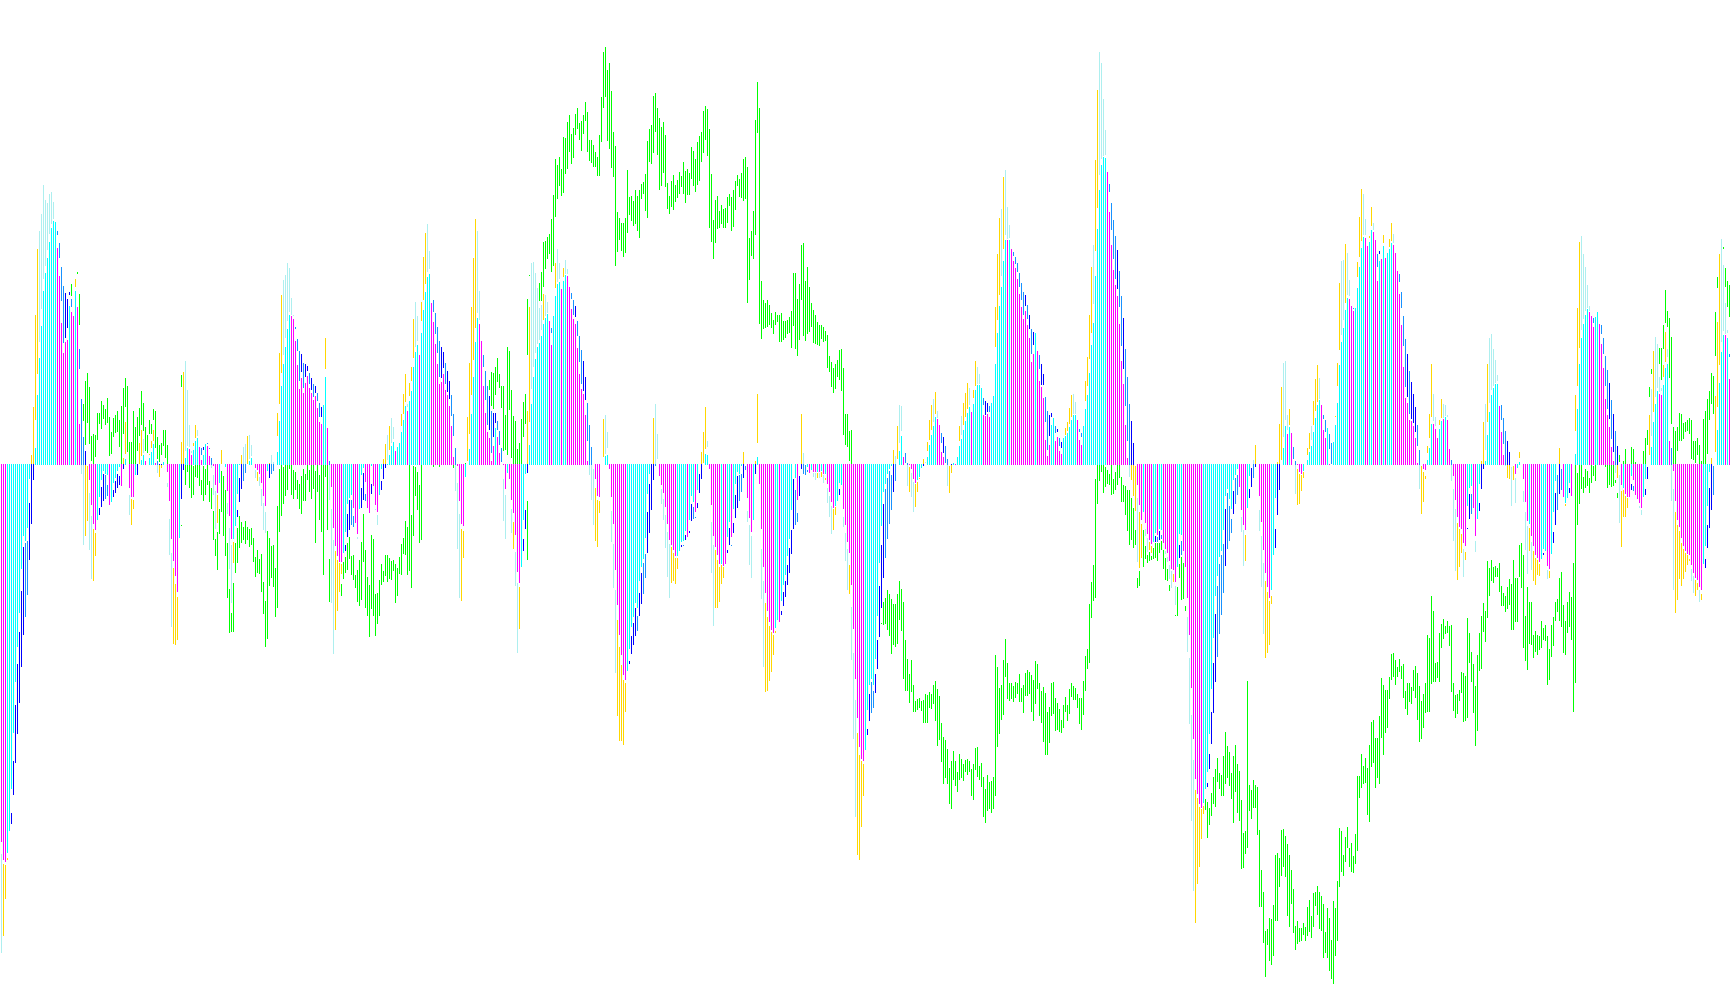
This tool is a specialized technical indicator designed for the MetaTrader platform to help traders visualize market momentum and trend direction by analyzing price averages. It specifically focuses on the relationship between three different moving averages, providing a color-coded visual representation of market behavior.
Core Functionality
The logic operates by comparing three distinct sets of average prices (Fast 1, Fast 2, and Slow). Depending on the user's preference, it calculates these using either "Double Exponential Moving Averages" (DEMA) or standard "Exponential Moving Averages" (EMA). By subtracting the Slow average from both Fast averages, the tool isolates the relative strength of the current price movement against a longer-term trend.
Visual Logic and Color Coding
The script translates complex mathematical differences into a simplified visual system using histograms and lines:
-
Trend Momentum (Blue vs. Red): The indicator monitors the "speed" at which the gap between the two Fast averages is changing. If the momentum is increasing compared to the previous candle, the data points are highlighted in Blue. If the momentum is slowing down or decreasing, they appear in Red.
-
Directional Strength (Green vs. Orange): The tool further analyzes whether the primary trend is moving upward or downward.
- Green highlights are used when the averages are trending upward, indicating bullish momentum.
- Orange highlights are used when the averages are trending downward, indicating bearish momentum.
Summary for the Trader
Essentially, this script acts as a "momentum thermometer." Instead of just showing you where the price is, it shows you how fast and in what direction the price is moving. By observing the colors on your chart, you can quickly identify whether the market's current strength is accelerating, decelerating, or shifting direction without having to manually calculate multiple overlapping averages.
//+------------------------------------------------------------------+
//|                                                  MACD_3_DEMA.mq4 |
//+------------------------------------------------------------------+
#property link "http://www.forexfactory.com/showthread.php?t=29419"
#property indicator_separate_window
#property indicator_buffers 8
#property indicator_level1  0.0
#property indicator_color1  Blue
#property indicator_color2  Blue
#property indicator_color3  Red
#property indicator_color4  Red
#property indicator_color5  Green
#property indicator_color6  Orange
#property indicator_color7  SkyBlue
#property indicator_color8  Tomato
#property indicator_width1  2
#property indicator_width2  2
#property indicator_width3  2
#property indicator_width4  2
#property indicator_width5  2
#property indicator_width6  2
#property indicator_width7  2
#property indicator_width8  2

//---- input parameters
extern int	Fast1	= 5,
            Fast2	= 13,
				Slow	= 50;
extern bool DEMAs	= true;

//---- indicator buffers
double	Fast1_Buffer[],
			Fast2_Buffer[],
			Blue1_Buffer[],
			Blue2_Buffer[],
			Red1_Buffer[],
			Red2_Buffer[],
			Green_Buffer[],
			Ornge_Buffer[];

//+------------------------------------------------------------------+
//| Custom indicator initialization function                         |
//+------------------------------------------------------------------+
int init()
{
	IndicatorShortName("MACD of 3 DEMAs("+Fast1+","+Fast2+","+Slow+")");
	SetIndexStyle(0,DRAW_HISTOGRAM);
	SetIndexStyle(1,DRAW_HISTOGRAM);
	SetIndexStyle(2,DRAW_HISTOGRAM);
	SetIndexStyle(3,DRAW_HISTOGRAM);
	SetIndexStyle(4,DRAW_HISTOGRAM);
	SetIndexStyle(5,DRAW_HISTOGRAM);
	SetIndexStyle(6,DRAW_LINE);
	SetIndexStyle(7,DRAW_LINE);
	SetIndexBuffer(0,Blue1_Buffer);
	SetIndexBuffer(1,Blue2_Buffer);
	SetIndexBuffer(2,Red1_Buffer);
	SetIndexBuffer(3,Red2_Buffer);
	SetIndexBuffer(4,Green_Buffer);
	SetIndexBuffer(5,Ornge_Buffer);
	SetIndexBuffer(6,Fast1_Buffer);
	SetIndexBuffer(7,Fast2_Buffer);
}

int start()
{
	int limit = Bars-1-IndicatorCounted();

//---- DEMAs and MACD
	for(int i = limit; i >= 0; i--)
	{
		if(DEMAs)
		{
			Fast1_Buffer[i] = iCustom(NULL,0,"DEMA",Fast1,0,i)-
									iCustom(NULL,0,"DEMA",Slow, 0,i);
			Fast2_Buffer[i] = iCustom(NULL,0,"DEMA",Fast2,0,i)-
									iCustom(NULL,0,"DEMA",Slow, 0,i);
		}
		else
		{
			Fast1_Buffer[i] = iMA(NULL,0,Fast1,0,MODE_EMA,PRICE_CLOSE,i)-
									iMA(NULL,0,Slow, 0,MODE_EMA,PRICE_CLOSE,i);
			Fast2_Buffer[i] = iMA(NULL,0,Fast2,0,MODE_EMA,PRICE_CLOSE,i)-
									iMA(NULL,0,Slow, 0,MODE_EMA,PRICE_CLOSE,i);
		}

		Green_Buffer[i] = 0.0;
		Ornge_Buffer[i] = 0.0;
		Blue1_Buffer[i] = 0.0;
		Blue2_Buffer[i] = 0.0;
		Red1_Buffer[i]  = 0.0;
		Red2_Buffer[i]  = 0.0;

	//---- Colored Bars
		if(Fast1_Buffer[i]-Fast2_Buffer[i] > Fast1_Buffer[i+1]-Fast2_Buffer[i+1])
		{
			Blue1_Buffer[i] = Fast1_Buffer[i];
			Blue2_Buffer[i] = Fast2_Buffer[i];
		}
		else
		{
			Red1_Buffer[i] = Fast1_Buffer[i];
			Red2_Buffer[i] = Fast2_Buffer[i];
		}

		if(Fast2_Buffer[i] > Fast2_Buffer[i+1])
		{
			if(Fast1_Buffer[i] > 0.0 && Fast2_Buffer[i] > 0.0)
				Green_Buffer[i] = MathMin(Fast1_Buffer[i],Fast2_Buffer[i]);
			if(Fast1_Buffer[i] < 0.0 && Fast2_Buffer[i] < 0.0)
				Green_Buffer[i] = MathMax(Fast1_Buffer[i],Fast2_Buffer[i]);
		}
		else
		{
			if(Fast1_Buffer[i] > 0.0 && Fast2_Buffer[i] > 0.0)
				Ornge_Buffer[i] = MathMin(Fast1_Buffer[i],Fast2_Buffer[i]);
			if(Fast1_Buffer[i] < 0.0 && Fast2_Buffer[i] < 0.0)
				Ornge_Buffer[i] = MathMax(Fast1_Buffer[i],Fast2_Buffer[i]);
		}
	}

//----
	return(0);
}
Comments