MACD_Divergence
Download script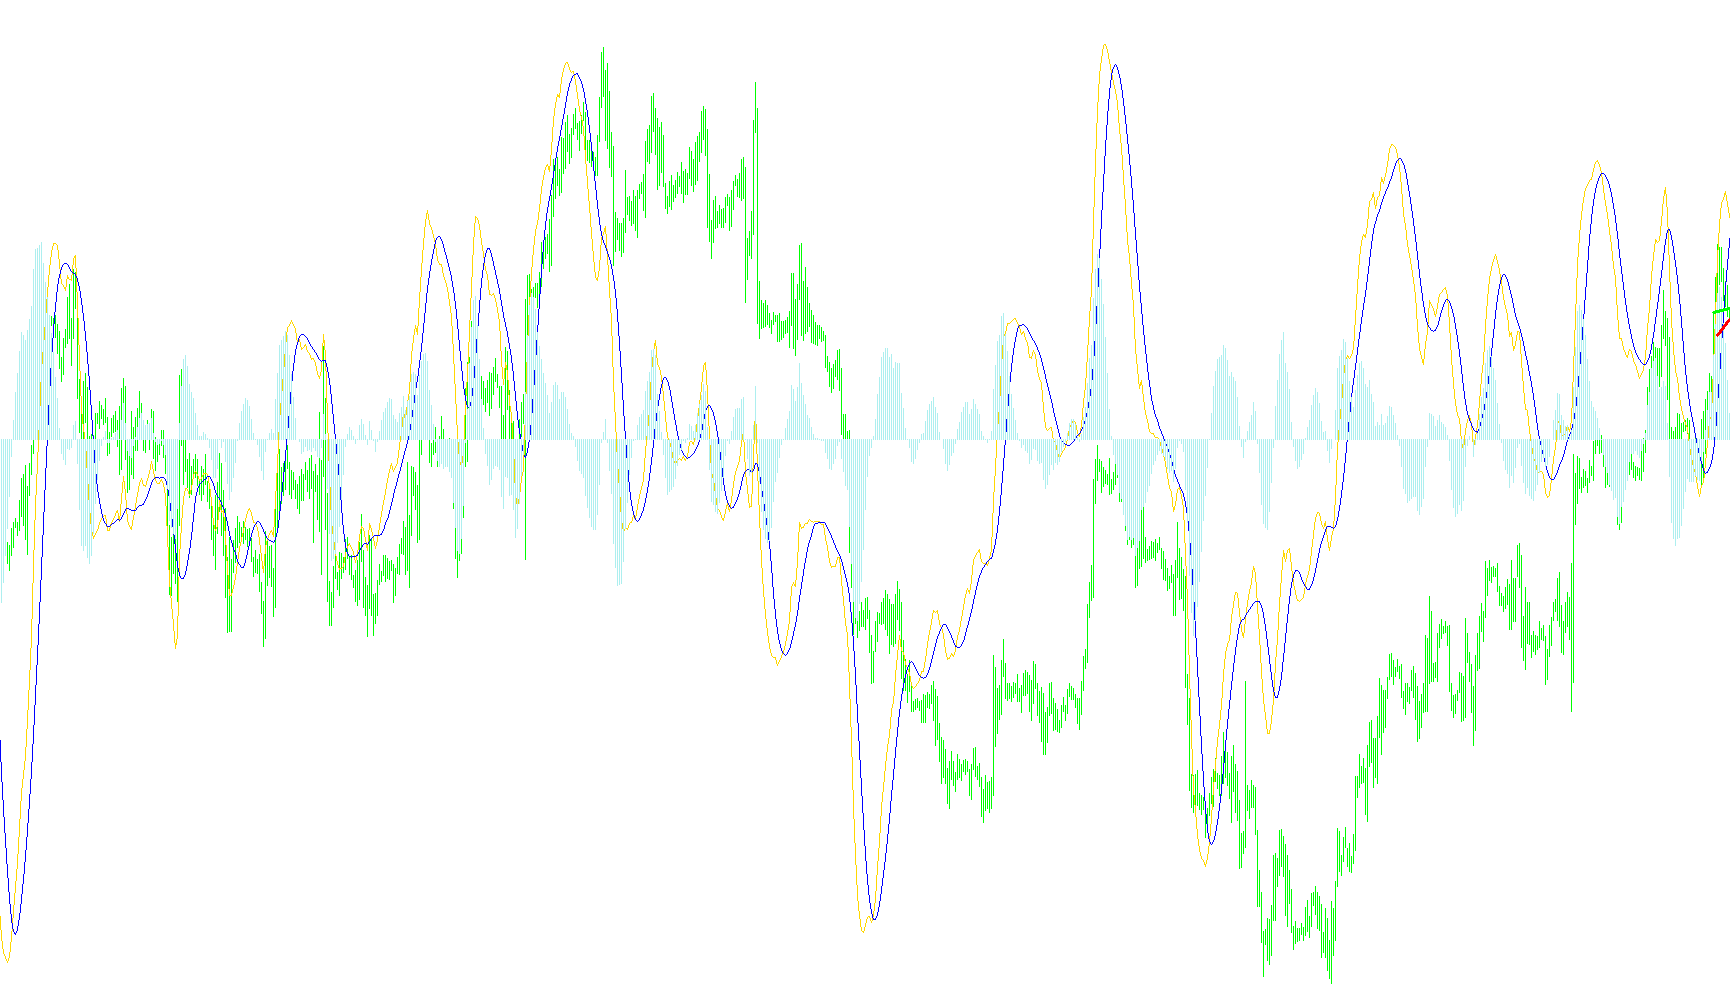
This script is a specialized technical analysis tool designed for the MetaTrader platform to identify "divergences." In trading, a divergence occurs when the price of an asset moves in one direction, but a momentum indicator (in this case, the MACD) moves in the opposite direction. This often signals that the current trend is losing strength and a potential reversal may be coming.
Core Functionality
The script automates the detection of these discrepancies by comparing two different types of data simultaneously: the actual price movement on your chart and the momentum behavior of the MACD (Moving Average Convergence Divergence) indicator.
How the Logic Works
1. Indicator Calculation First, the script calculates three primary values based on standard Moving Averages (Fast EMA, Slow EMA, and Signal SMA). It builds a visual representation of the MACD in a separate window, showing both the main momentum line and the signal line.
2. Identifying Pivot Points The script scans historical price data to identify significant "Highs" and "Lows." It looks for specific points where the price reached a peak or a valley. To ensure accuracy, it uses a user-defined "Spread" (a small buffer zone) to distinguish between minor fluctuations and true structural turning points.
3. Divergence Detection Once it identifies these major peaks and valleys, the script performs a two-way comparison:
- Price vs. MACD Highs: It checks if the price is making a new high while the MACD momentum is actually decreasing (or vice versa).
- Price vs. MACD Lows: It checks if the price is dropping to a new low while the MACD momentum is staying firm or rising.
4. Visual Mapping When the script successfully identifies a divergence, it automatically draws trendlines on your screen to highlight the mismatch:
- Chart Trendlines: These are drawn directly on your main price chart to show where the price peaks or valleys are located.
- MACD Trendlines: These appear in the indicator window, connecting the corresponding points on the MACD line.
By displaying these two sets of lines side-by-side, the tool allows a trader to see at a glance whether the "engine" of the market (the momentum) is struggling to keep up with the "body" of the market (the price).
Key Features for the User
- Automated Trendlines: Instead of manually drawing lines to find discrepancies, the script calculates the coordinates and draws them automatically.
- Customizable Sensitivity: Users can adjust the Fast/Slow Moving Averages and the "Spread" to tune how sensitive the tool is to price changes.
- Real-time Data: The script constantly updates these calculations as new candles form on the chart, providing dynamic feedback on current market trends.
/*-----------------------------+
|			       |
| Shared by www.Aptrafx.com    |
|			       |
+------------------------------*/

//+------------------------------------------------------------------+
//|                                              MACD_Divergence.mq4 |
//|                      Copyright © 2006, Cartwright Software Corp. |
//|                                        http://www.cartwright.net |
//|                                         Author: Randy Cartwright |
//+------------------------------------------------------------------+
#property copyright "Copyright © 2006, Cartwright Software Corp."
#property link      "http://www.cartwright.net"

#property indicator_separate_window
#property indicator_buffers 3
#property indicator_color1 Teal //Aqua
#property indicator_color2 Red
#property indicator_color3 Blue //DodgerBlue //Silver
//---- input parameters
extern int shift=1, DivSpread=15;
extern bool ShowComments=false;
extern int       FastEMA=12;
extern int       SlowEMA=26;
extern int       SignalSMA=9;

double macdHigh1, macdHigh2, val3, val4;
double macdLow1, macdLow2;
//---- buffers
double ExtMapBuffer3[];
//---- indicator buffers
double ExtSilverBuffer[];
double ExtRedBuffer[];
double ExtHistoryBuffer[];

//+------------------------------------------------------------------+
//| Custom indicator initialization function                         |
//+------------------------------------------------------------------+
int init()
  {
//---- drawing settings
   SetIndexStyle(0,DRAW_LINE);
   SetIndexStyle(1,DRAW_LINE);
   SetIndexStyle(2,DRAW_HISTOGRAM);
   SetIndexBuffer(2,ExtMapBuffer3);
//----
   SetIndexDrawBegin(1,SignalSMA);
   IndicatorDigits(5);
//---- indicator buffers mapping
   SetIndexBuffer(0, ExtSilverBuffer);
   SetIndexBuffer(1, ExtRedBuffer);
   SetIndexBuffer(2, ExtHistoryBuffer);
//---- name for DataWindow and indicator subwindow label
   IndicatorShortName("Randy_Cs_MACD("+FastEMA+","+SlowEMA+","+SignalSMA+")");
//---- initialization done
   return(0);
  }
//+------------------------------------------------------------------+
//| Custom indicator deinitialization function                       |
//+------------------------------------------------------------------+
int deinit()
  {
//----
ObjectDelete("MACD_HL");
ObjectDelete("MACD_LL");
ObjectDelete("Chart_HL");
ObjectDelete("Chart_LL");
//----
   return(0);
  }
//+------------------------------------------------------------------+
//| Moving Averages Convergence/Divergence                           |
//+------------------------------------------------------------------+
int start()
  {
   int limit;
   int counted_bars=IndicatorCounted();
//---- check for possible errors
   if(counted_bars<0) return(-1);
//---- last counted bar will be recounted
   if(counted_bars>0) counted_bars--;
   limit=Bars-counted_bars;
//---- macd counted in the 1-st buffer

   for(int i=0; i<limit; i++)
      ExtSilverBuffer[i]=iMA(NULL,0,FastEMA,0,MODE_EMA,PRICE_CLOSE,i)-iMA(NULL,0,SlowEMA,0,MODE_EMA,PRICE_CLOSE,i);
//---- signal line counted in the 2-nd buffer
   for(i=0; i<limit; i++)
      ExtRedBuffer[i]=iMAOnArray(ExtSilverBuffer,Bars,SignalSMA,0,MODE_SMA,i);
   for(i=0; i<limit; i++)
      ExtHistoryBuffer[i]=iMA(NULL,0,FastEMA,0,MODE_EMA,PRICE_CLOSE,i)-iMA(NULL,0,SlowEMA,0,MODE_EMA,PRICE_CLOSE,i) - iMAOnArray(ExtSilverBuffer,Bars,SignalSMA,0,MODE_SMA,i);
/*
macdHigh1=iMA(NULL,0,FastEMA,0,MODE_EMA,PRICE_CLOSE,20)-iMA(NULL,0,SlowEMA,0,MODE_EMA,PRICE_CLOSE,20); //Teal__ExtSilverBuffer
macdHigh2=iMAOnArray(ExtSilverBuffer,Bars,SignalSMA,0,MODE_SMA,20); //Red Line ExtRedBuffer
val3=iMA(NULL,0,FastEMA,0,MODE_EMA,PRICE_CLOSE,10)-iMA(NULL,0,SlowEMA,0,MODE_EMA,PRICE_CLOSE,10) - iMAOnArray(ExtSilverBuffer,Bars,SignalSMA,0,MODE_SMA,10);
*/

string timeFrame=0; //PERIOD_M15
int firstHighTime, firstLowTime;
int secondHighTime, secondLowTime;
double firstHigh, secondHigh, firstLow, secondLow;
bool findsecondHigh=false, findsecondHighCompleted=false, findsecondLow=false, findsecondLowCompleted=false;
bool findsecondHighLow=false, findsecondLowHigh=false;

firstHighTime=iTime(NULL,timeFrame, shift);
firstHigh=iHigh(NULL,timeFrame,shift);// + iLow(NULL,timeFrame,shift)) /2;
firstLow=iLow(NULL,timeFrame,shift);// + iLow(NULL,timeFrame,shift)) /2;
firstLowTime=iTime(NULL,timeFrame, shift);
//macdPrice
macdHigh1=iMA(NULL,timeFrame,FastEMA,0,MODE_EMA,PRICE_CLOSE,shift)-iMA(NULL,timeFrame,SlowEMA,0,MODE_EMA,PRICE_CLOSE,shift);
macdLow1=iMA(NULL,timeFrame,FastEMA,0,MODE_EMA,PRICE_CLOSE,shift)-iMA(NULL,timeFrame,SlowEMA,0,MODE_EMA,PRICE_CLOSE,shift);

int candleHigh, candleLow;
double high, low;

for(i=shift+1; i<Bars; i++) { //limit
// High Divergence
high=iHigh(NULL,timeFrame,i);// + iLow(NULL,timeFrame,i)) /2;
if (findsecondHigh==false && findsecondHighLow==false && high + DivSpread*Point  <= firstHigh) //&& findsecondHigh==false
    findsecondHigh=true;

if (findsecondHigh==true && findsecondHighCompleted==false && high >= firstHigh) {
   secondHigh=iHigh(NULL,timeFrame,i);// + iLow(NULL,timeFrame,i)) /2;
   secondHighTime=iTime(NULL,timeFrame, i);
   macdHigh2=iMA(NULL,timeFrame,FastEMA,0,MODE_EMA,PRICE_CLOSE,i)-iMA(NULL,timeFrame,SlowEMA,0,MODE_EMA,PRICE_CLOSE,i);
   findsecondHighCompleted=true;
   }
if (findsecondHigh==false && findsecondHighLow==false && high - DivSpread*Point  >= firstHigh) //&& findsecondHigh==false
    {findsecondHighLow=true;}

if (findsecondHighLow==true && findsecondHighCompleted==false && high <= firstHigh) {
   secondHigh=iHigh(NULL,timeFrame,i);// + iLow(NULL,timeFrame,i)) /2;
   secondHighTime=iTime(NULL,timeFrame, i);
   macdHigh2=iMA(NULL,timeFrame,FastEMA,0,MODE_EMA,PRICE_CLOSE,i)-iMA(NULL,timeFrame,SlowEMA,0,MODE_EMA,PRICE_CLOSE,i);
   findsecondHighCompleted=true;
   }

// Low Divergence
low=iLow(NULL,timeFrame,i);// + iLow(NULL,timeFrame,i)) /2;
if (findsecondLow==false && findsecondLowHigh==false && low - DivSpread*Point  >= firstLow) //&& findsecondLow==false
    findsecondLow=true;
//else
if (findsecondLow==false && findsecondLowHigh==false && low + DivSpread*Point  <= firstLow) //&& findsecondHigh==false
    {findsecondLowHigh=true;}

if (findsecondLow==true && findsecondLowCompleted==false && low <= firstLow) { // || high <= firstLow) {
   secondLow=iLow(NULL,timeFrame,i);// + iLow(NULL,timeFrame,i)) /2;
   secondLowTime=iTime(NULL,timeFrame, i);
   macdLow2=iMA(NULL,timeFrame,FastEMA,0,MODE_EMA,PRICE_CLOSE,i)-iMA(NULL,timeFrame,SlowEMA,0,MODE_EMA,PRICE_CLOSE,i);
   findsecondLowCompleted=true;
   }
//else
if (findsecondLowHigh==true && findsecondLowCompleted==false && low >= firstLow) { // || high >= firstLow) {
   secondLow=iLow(NULL,timeFrame,i);// + iLow(NULL,timeFrame,i)) /2;
   secondLowTime=iTime(NULL,timeFrame, i);
   macdLow2=iMA(NULL,timeFrame,FastEMA,0,MODE_EMA,PRICE_CLOSE,i)-iMA(NULL,timeFrame,SlowEMA,0,MODE_EMA,PRICE_CLOSE,i);
   findsecondLowCompleted=true;
   }

if (findsecondHighCompleted==true && findsecondLowCompleted==true) break;

} // END FOR


//  MACD High Trendline
ObjectDelete("MACD_HL");
ObjectCreate("MACD_HL",OBJ_TREND,1,secondHighTime,macdHigh2,firstHighTime,macdHigh1);//secondLowTime,secondLow,firstLowTime,firstLow);
ObjectSet("MACD_HL",OBJPROP_COLOR,Lime); //Goldenrod
ObjectSet("MACD_HL",OBJPROP_WIDTH, 3);
ObjectSet("MACD_HL",OBJPROP_RAY, false);

//  Chart High Trendline
ObjectDelete("Chart_HL");
ObjectCreate("Chart_HL",OBJ_TREND,0,secondHighTime,secondHigh,firstHighTime,firstHigh);//secondHighTime,secondHigh,firstHighTime,firstHigh);
ObjectSet("Chart_HL",OBJPROP_COLOR,Lime);
ObjectSet("Chart_HL",OBJPROP_WIDTH, 3);
ObjectSet("Chart_HL",OBJPROP_RAY, false);

//  MACD Low Trendline
ObjectDelete("MACD_LL");
ObjectCreate("MACD_LL",OBJ_TREND,1,secondLowTime,macdLow2,firstLowTime,macdLow1);//secondLowTime,secondLow,firstLowTime,firstLow);
ObjectSet("MACD_LL",OBJPROP_COLOR,Red); //Goldenrod
ObjectSet("MACD_LL",OBJPROP_WIDTH, 3);
ObjectSet("MACD_LL",OBJPROP_RAY, false);

//  Chart Low Trendline
ObjectDelete("Chart_LL");
ObjectCreate("Chart_LL",OBJ_TREND,0,secondLowTime,secondLow,firstLowTime,firstLow);//secondHighTime,secondHigh,firstHighTime,firstHigh);
ObjectSet("Chart_LL",OBJPROP_COLOR,Red);
ObjectSet("Chart_LL",OBJPROP_WIDTH, 3);
ObjectSet("Chart_LL",OBJPROP_RAY, false);
ObjectSet("Chart_LL",OBJPROP_BACK, false);

/*
ObjectSet("MACD_HL",OBJPROP_TIME1,firstLowTime); ObjectSet("MACD_HL",OBJPROP_TIME2,secondLowTime);
ObjectSet("MACD_HL",OBJPROP_PRICE1,firstLow); ObjectSet("MACD_HL",OBJPROP_PRICE2,secondLow);
ObjectSet("MACD_HL",OBJPROP_STYLE, STYLE_DOT);
ObjectSet("MACD_HL",OBJPROP_TIME1,firstLowTime); ObjectSet("MACD_HL",OBJPROP_TIME2,secondLowTime);
ObjectSet("MACD_HL",OBJPROP_PRICE1,firstLowPrice);ObjectSet("MACD_HL",OBJPROP_PRICE2,secondLowPrice);
ObjectsRedraw();
*/


if (ShowComments==true) {
Comment("macdHigh1 = ",DoubleToStr(macdHigh1,6)," macdHigh2 = ",DoubleToStr(macdHigh2,6), " val3 = ",
   DoubleToStr(val3,5), " Windows count = ", WindowsTotal(),
   " MACD Win =",WindowFind("BillWin_MACD("+FastEMA+","+SlowEMA+","+SignalSMA+")")
   , " MA = ",WindowFind("RandyTest"), " ExtHistoryBuffer[i] = ",ExtHistoryBuffer[i],"\n",
   "firstHigh = ",firstHigh, " secondHigh = ",secondHigh,"\n",
   " firstHighTime = ",firstHighTime, " secondHighTime = ",secondHighTime,"\n",
   "candleHigh = ",candleHigh, " candleLow = ",candleLow);
   }
//---- done
   return(0);
  }


//+------------------------------------------------------------------+?
Comments