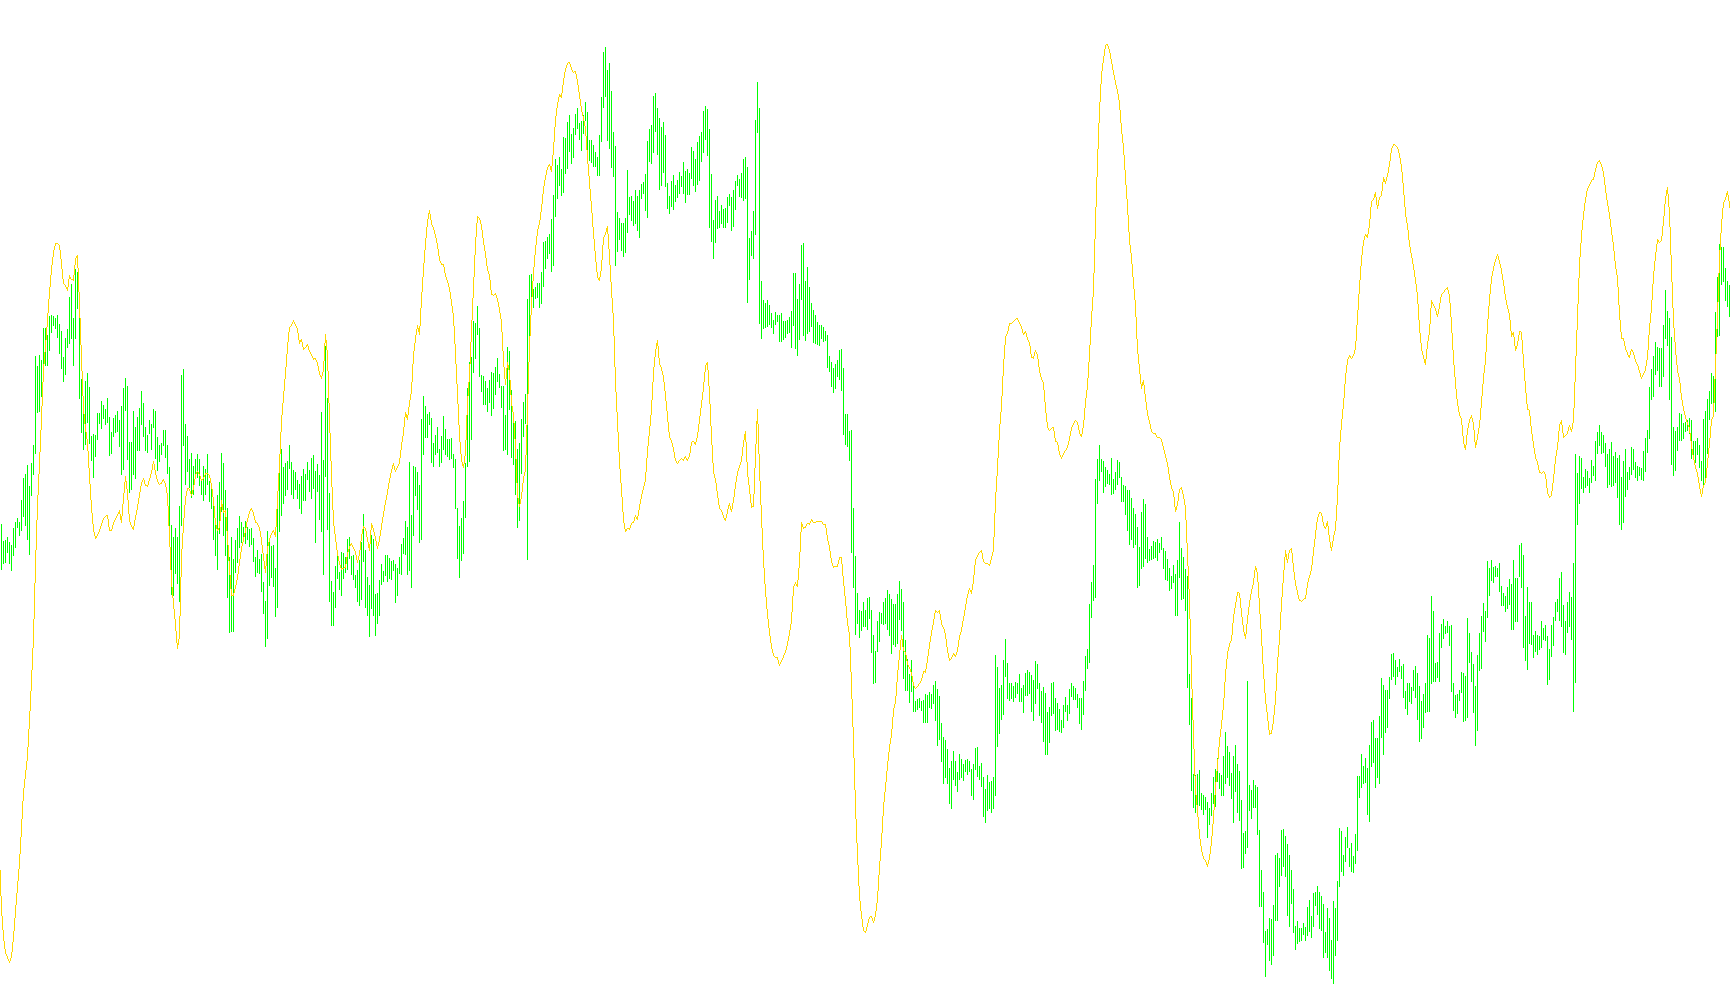
This tool is a custom technical analysis indicator designed to help traders visualize and interpret market momentum. It functions by calculating the relationship between two different moving averages to identify trends, signal changes, and the strength of price movement.
Core Logic Overview
The indicator works through three primary layers of calculation:
1. Trend Analysis (The MACD Line) The script first looks at two different "speeds" of price averages—a fast-moving average and a slow-moving average. By subtracting the slow average from the fast one, the tool produces a base line (the MACD).
- When this line is above zero, it suggests that short-term price momentum is stronger than long-term momentum.
- When it falls below zero, it indicates that short-term momentum is weakening relative to the longer trend.
2. Smoothing and Signaling (The Signal Line) To filter out "noise" and prevent traders from reacting to every minor price flicker, the script takes the base line mentioned above and applies a third calculation (a Simple Moving Average). This creates a "Signal Line." This secondary line acts as a smoother guide; when the base MACD line crosses over this signal line, it often serves as a visual cue that the trend may be shifting.
3. Momentum Visualization (The Histogram) Beyond just showing lines, the script calculates the distance between the MACD line and the Signal Line. It multiplies this difference by a specific factor to emphasize the magnitude of the movement. This data is then displayed as a histogram:
- Positive Values: When the momentum is moving upward or staying strong above the signal, it creates a visible bar (histogram) above the zero mark.
- Negative Values: When momentum is dropping or falling below the signal, it creates a bar below the zero mark.
Visual Representation
The tool provides a multi-layered visual experience on your chart:
- Lines: You will see two distinct lines representing the primary trend and the smoothed signal.
- Histogram: A set of vertical bars provides an immediate at-a-glance view of momentum intensity. The height of these bars tells you not just which direction the price is moving, but how much "power" is behind that move.
By combining these three elements, the script allows you to see the current trend, identify potential turning points through line crossovers, and gauge the strength of the market's push in real-time.
/*-----------------------------+
|			       |
| Shared by www.Aptrafx.com    |
|			       |
+------------------------------*/

//+------------------------------------------------------------------+
//|                                                  Custom MACD.mq4 |
//|                      Copyright © 2004, MetaQuotes Software Corp. |
//|                                       http://www.metaquotes.net/ |
//+------------------------------------------------------------------+
#property  copyright "Copyright © 2004, MetaQuotes Software Corp."
#property  link      "http://www.metaquotes.net/"
//---- indicator settings
#property  indicator_separate_window
#property  indicator_buffers 4
#property  indicator_color1  Aqua
#property  indicator_color2  Crimson
#property  indicator_color3  Red
#property  indicator_color4  LimeGreen
//int indicator_color3;
//---- indicator parameters
extern int FastEMA=12;
extern int SlowEMA=26;
extern int SignalSMA=9;
//---- indicator buffers
double     ind_buffer1[];
double     ind_buffer2[];
double     ind_buffer3[];
double     ind_buffer4[];
double     temp;

//+------------------------------------------------------------------+
//| Custom indicator initialization function                         |
//+------------------------------------------------------------------+
int init()
  {
//---- drawing settings
   SetIndexStyle(0,DRAW_LINE,STYLE_SOLID,1);
   SetIndexStyle(1,DRAW_LINE,STYLE_SOLID,1);
   SetIndexStyle(2,DRAW_HISTOGRAM,STYLE_SOLID,1);
   SetIndexStyle(3,DRAW_HISTOGRAM,STYLE_SOLID,1);
   SetIndexDrawBegin(1,SignalSMA);
   IndicatorDigits(MarketInfo(Symbol(),MODE_DIGITS)+1);
//---- indicator buffers mapping
   if(!SetIndexBuffer(0,ind_buffer1) && !SetIndexBuffer(1,ind_buffer2)&& !SetIndexBuffer(2,ind_buffer3)&& !SetIndexBuffer(3,ind_buffer4))
      Print("cannot set indicator buffers!");
//---- name for DataWindow and indicator subwindow label
   IndicatorShortName("MACD("+FastEMA+","+SlowEMA+","+SignalSMA+")");
   SetIndexLabel(0,"MACD");
   SetIndexLabel(1,"Signal");
//---- initialization done
   return(0);
  }
//+------------------------------------------------------------------+
//| Moving Averages Convergence/Divergence                           |
//+------------------------------------------------------------------+
int start()
  {
   int limit;
   int counted_bars=IndicatorCounted();
//---- check for possible errors
   if(counted_bars<0) return(-1);
//---- last counted bar will be recounted
   if(counted_bars>0) counted_bars--;
   limit=Bars-counted_bars;
//---- macd counted in the 1-st buffer
   for(int i=0; i<limit; i++)
      ind_buffer1[i]=iMA(NULL,0,FastEMA,0,MODE_EMA,PRICE_CLOSE,i)-iMA(NULL,0,SlowEMA,0,MODE_EMA,PRICE_CLOSE,i);
//---- signal line counted in the 2-nd buffer
   for(i=0; i<limit; i++)
      ind_buffer2[i]=iMAOnArray(ind_buffer1,Bars,SignalSMA,0,MODE_SMA,i);

   for(i=0; i<limit; i++)
      {
       temp=1.3*(ind_buffer1[i]-ind_buffer2[i]);
       if(temp>0) {ind_buffer3[i]=temp;ind_buffer4[i]=0;}
       else       {ind_buffer3[i]=0;ind_buffer4[i]=temp;}

      }

//---- done
   return(0);
  }
Comments