MACD_LSMA_EMA
Download script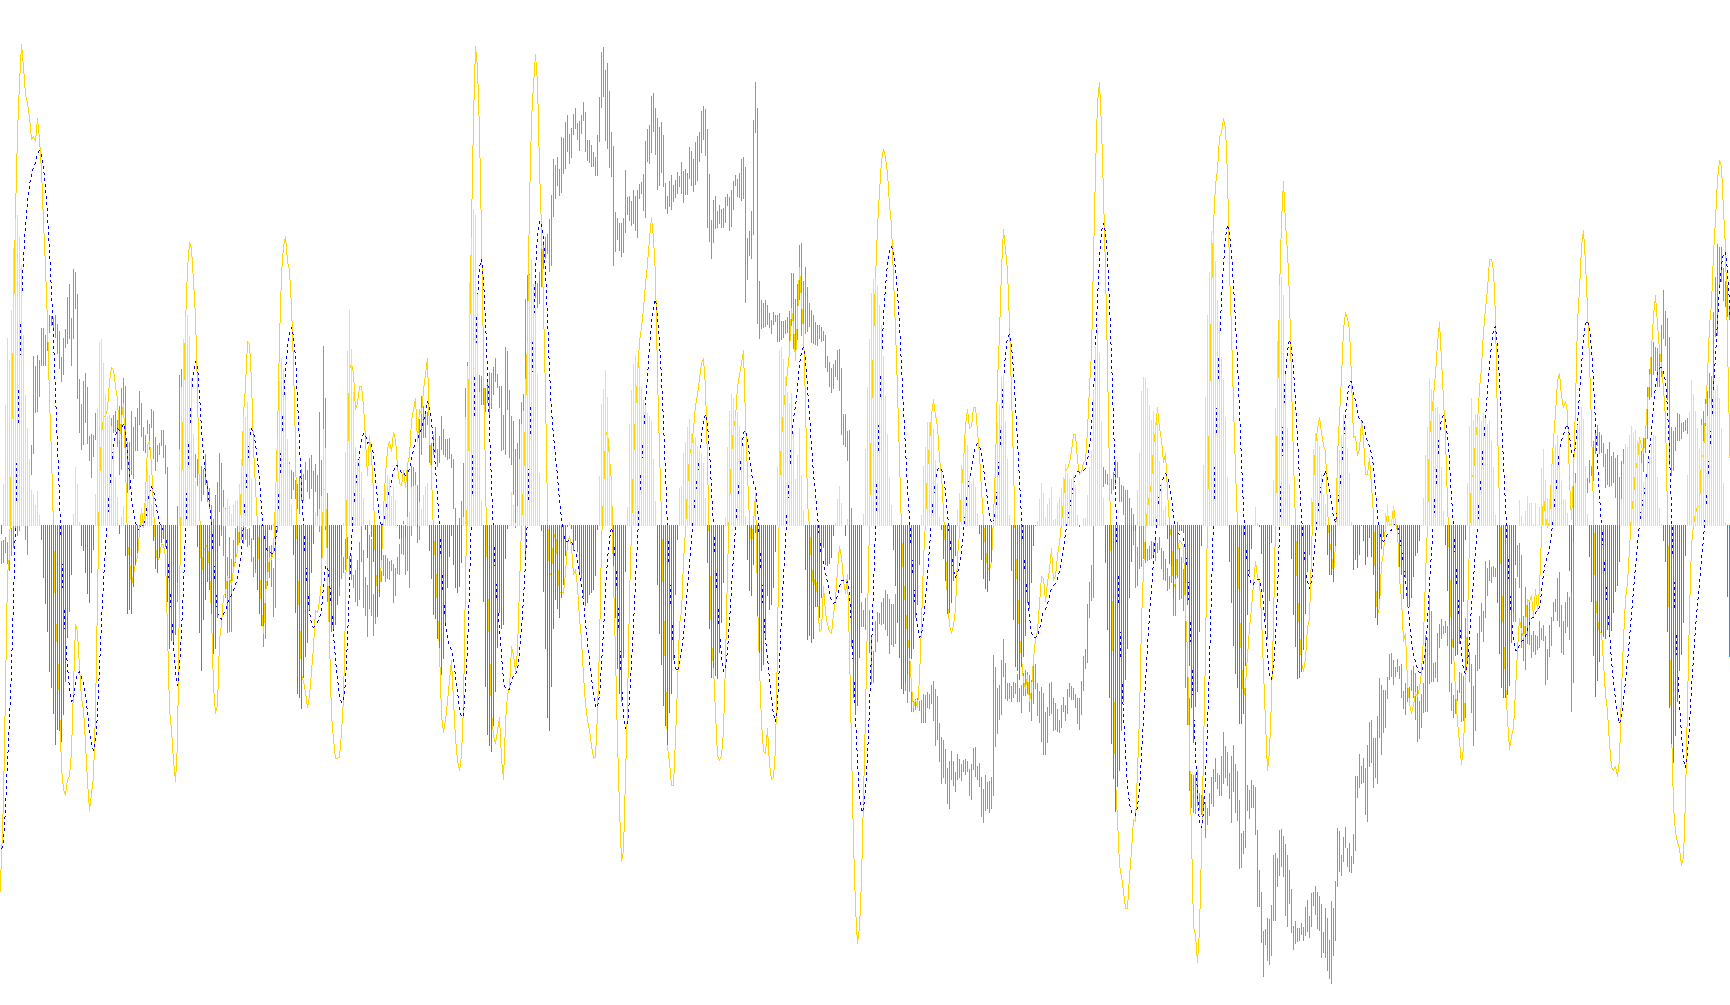
This technical script is a specialized financial analysis tool designed for the MetaTrader platform. It provides traders with visual data to help identify momentum shifts and trend directions by combining two different types of mathematical averages: the Least Squares Moving Average (LSMA) and the Exponential Moving Average (EMA).
Core Logic Overview
The primary goal of this script is to provide a modified version of the classic MACD (Moving Average Convergence Divergence) indicator. While standard MACD indicators usually rely on simple exponential curves, this version replaces those calculations with the LSMA method to potentially offer a more responsive view of price trends.
How the Calculations Work
The logic flows through three distinct stages:
1. The LSMA Foundation Unlike standard moving averages that simply look at the average price over a window of time, the Least Squares Moving Average (LSMA) uses linear regression. This means it calculates a "best-fit" line for the price data. By using this as the foundation, the script attempts to identify the trend more accurately by accounting for the trajectory of the price rather than just its recent history.
2. The MACD Calculation The script takes two different LSMA periods—a "Fast" period and a "Slow" period—and calculates the difference between them.
- When the Fast LSMA is significantly higher than the Slow LSMA, it suggests upward momentum.
- When the Fast LSMA drops below the Slow LSMA, it suggests downward momentum.
3. The Signal Line and Histogram To make this data easier for a human to read, the script performs two final actions:
- Signal Line: It applies an Exponential Moving Average (EMA) to the MACD results. This smooths out the "noise" of the raw data, creating a secondary line that helps identify when momentum is actually changing direction.
- The Histogram: Finally, the script calculates the distance between the MACD value and the Signal Line. This result is displayed as a visual histogram (vertical bars). If the bars are above zero, it indicates bullish strength; if they are below zero, it indicates bearish strength.
Summary for the User
In simple terms, this tool tells you how fast the price is moving and in what direction. By using "Least Squares" logic instead of standard averages, it aims to react more precisely to price trends, while the histogram provides a clear, at-a-glance visual of whether the current market momentum is leaning positive or negative.
//+------------------------------------------------------------------+
//|                                                MACD_LSMA_EMA.mq4 |
//|                                    Copyright © 2007, Robert Hill |
//| Standard MACD modified to use LSMA instead of EMA                |
//+------------------------------------------------------------------+
#property  copyright "Copyright © 2004, MetaQuotes Software Corp."
#property  link      "http://www.metaquotes.net/"
//---- indicator settings
#property  indicator_separate_window
#property  indicator_buffers 4
#property  indicator_color1  Aqua
#property  indicator_color2  Red
#property  indicator_color3  Green
#property  indicator_color4  Red
//---- indicator parameters
extern int FastEMA=12;
extern int SlowEMA=26;
extern int SignalSMA=9;
//---- indicator buffers
double     MACD_buffer[];
double     Signal_buffer[];
double HistogramBufferUp[];
double HistogramBufferDown[];

//+------------------------------------------------------------------+
//| Custom indicator initialization function                         |
//+------------------------------------------------------------------+
int init()
  {
//---- drawing settings
   IndicatorDigits(MarketInfo(Symbol(),MODE_DIGITS)+1);
   SetIndexStyle(0,DRAW_LINE,STYLE_SOLID);
   SetIndexBuffer(0,MACD_buffer);
   SetIndexDrawBegin(0,SlowEMA);
   SetIndexStyle(1,DRAW_LINE,STYLE_DOT);
   SetIndexBuffer(1,Signal_buffer);
   SetIndexDrawBegin(1,SignalSMA);
   SetIndexStyle(2,DRAW_HISTOGRAM,STYLE_SOLID);
   SetIndexBuffer(2,HistogramBufferUp);
   SetIndexStyle(3,DRAW_HISTOGRAM,STYLE_SOLID);
   SetIndexBuffer(3,HistogramBufferDown);
   IndicatorDigits(MarketInfo(Symbol(),MODE_DIGITS)+1);
//---- name for DataWindow and indicator subwindow label
   IndicatorShortName("MACD_LSMA_EMA("+FastEMA+","+SlowEMA+","+SignalSMA+")");
   SetIndexLabel(0,"MACD");
   SetIndexLabel(1,"Signal");
   SetIndexLabel(2,"Histogram");
//---- initialization done
   return(0);
  }

//+------------------------------------------------------------------------+
//| LSMA - Least Squares Moving Average function calculation               |
//| LSMA_In_Color Indicator plots the end of the linear regression line    |
//+------------------------------------------------------------------------+

double LSMA(int Rperiod, int shift)
{
   int i;
   double sum;
   int length;
   double lengthvar;
   double tmp;
   double wt;

   length = Rperiod;

   sum = 0;
   for(i = length; i >= 1  ; i--)
   {
     lengthvar = length + 1;
     lengthvar /= 3;
     tmp = 0;
     tmp = ( i - lengthvar)*Close[length-i+shift];
     sum+=tmp;
    }
    wt = MathFloor(sum*6/(length*(length+1))/Point)*Point;

    return(wt);
}

//+------------------------------------------------------------------+
//| Moving Averages Convergence/Divergence                           |
//+------------------------------------------------------------------+
int start()
  {
   double temp;
   int limit;
   int counted_bars=IndicatorCounted();
//---- check for possible errors
   if(counted_bars<0) return(-1);
//---- last counted bar will be recounted
   if(counted_bars>0) counted_bars--;
   limit=Bars-counted_bars;
//---- macd counted in the 1-st buffer
   for(int i=0; i<limit; i++)
      MACD_buffer[i]=LSMA(FastEMA,i)-LSMA(SlowEMA,i);
//---- signal line counted in the 2-nd buffer
   for(i=0; i<limit; i++)
      Signal_buffer[i]=iMAOnArray(MACD_buffer,Bars,SignalSMA,0,MODE_EMA,i);
//---- done
   for(i=0; i<limit; i++)
   {
      HistogramBufferUp[i] = 0;
      HistogramBufferDown[i] = 0;
      temp = MACD_buffer[i] - Signal_buffer[i];
      if (temp >= 0)
        HistogramBufferUp[i] = temp;
      else
        HistogramBufferDown[i] = temp;

   }

   return(0);
  }
Comments