MACD_OsMA_AM_.3
Download script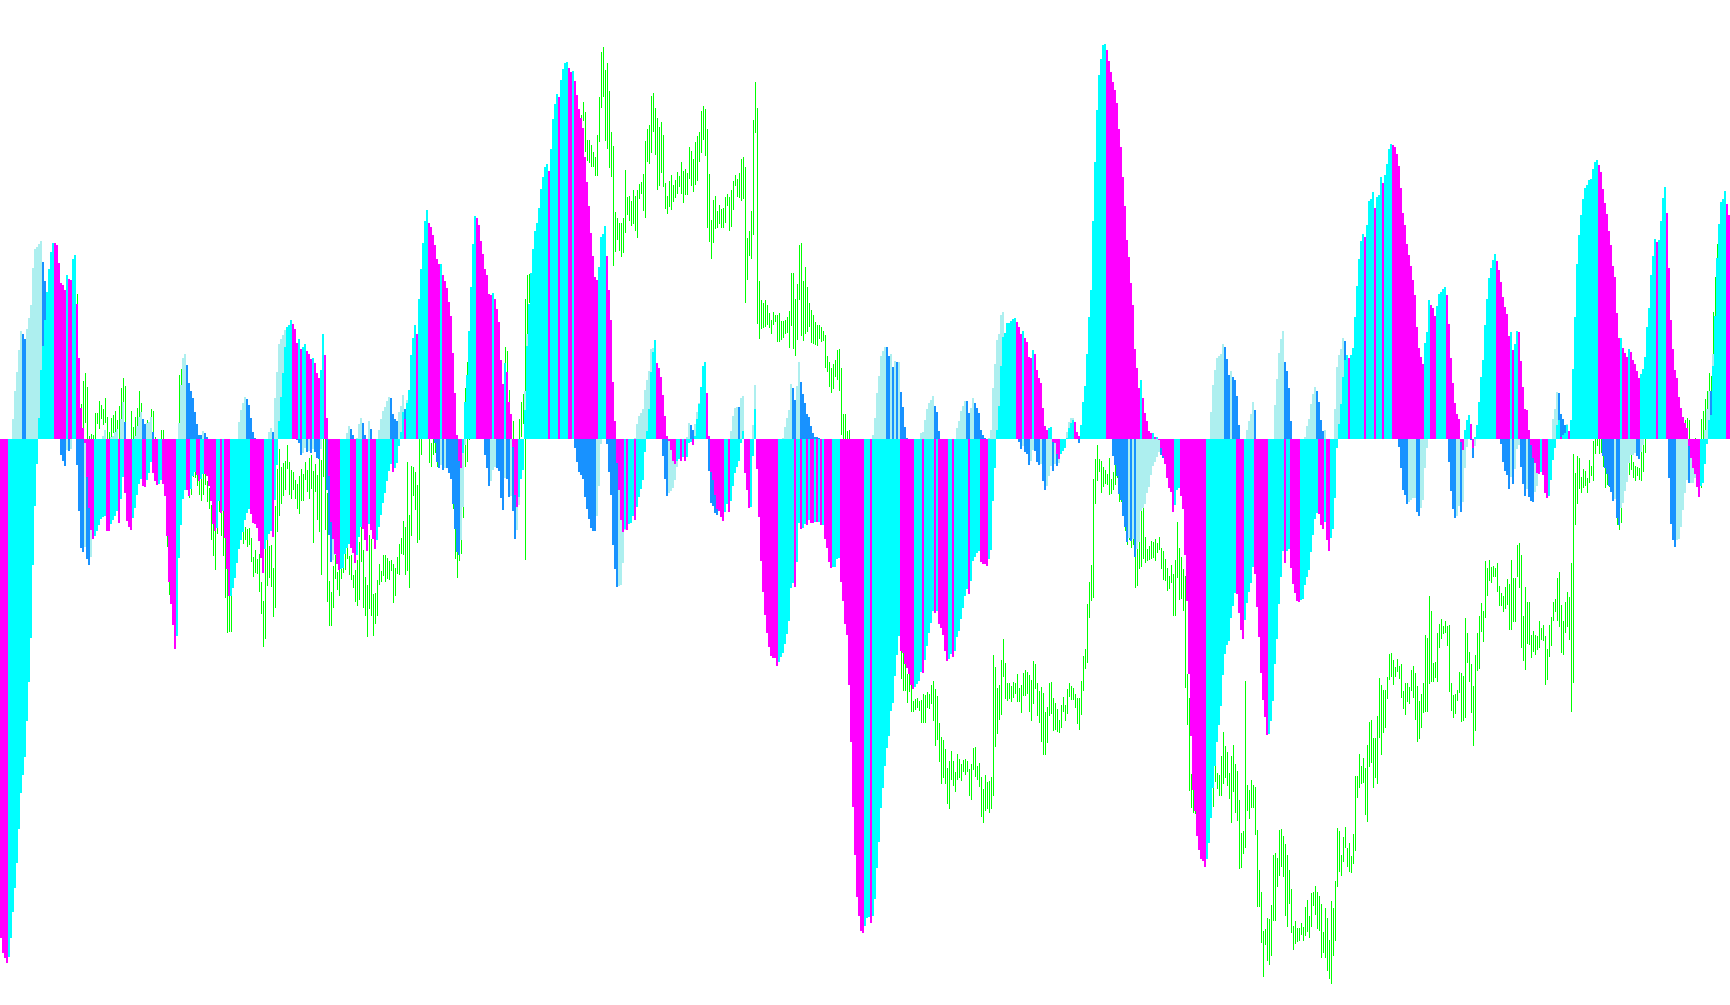
This custom indicator is designed to provide traders with a more nuanced view of market momentum by combining two well-known technical analysis tools: the MACD (Moving Average Convergence Divergence) and a specialized Oscillator logic.
The primary goal of this script is to identify shifts in trend direction and strength by visualizing three distinct components on your chart:
Core Components
- Trend Momentum Tracking: The script begins by calculating the difference between two moving averages (Fast and Slow). This is the foundation of the MACD, which helps determine whether price momentum is accelerating or decelerating.
- The Signal Smoothing: It takes that momentum data and applies a secondary "Signal" calculation. This creates a smoothed line that allows the script to compare current momentum against its recent average behavior.
- Directional Visualization: Rather than just showing raw lines, the script uses logic to determine the "flow" of the market. It identifies whether the current values are rising or falling compared to the previous period.
How it Displays Information
The indicator translates these complex calculations into four distinct visual elements in a separate window:
- Primary Momentum Peaks: The script highlights positive and negative momentum movements as colored histograms. This allows you to see at a glance if the "strength" of the move is increasing or decreasing.
- Dynamic Signal Switching: A unique feature of this logic is its ability to differentiate between upward and downward pressure. By tracking whether current values exceed previous ones, it creates a visual distinction: when momentum is falling, it highlights specific data points in one color; when it is rising, it shifts to another.
- Visual Separation: By splitting the data into "plus" and "minus" categories (labeled as OsMA+ / OsMA- and MACD+ / MACD-), the indicator helps you distinguish between bullish strength and bearish pressure simultaneously.
Summary of Use
Essentially, this script filters out the noise of standard price movements to show you the "pulse" of the market. It tells you not just where the price is going, but how fast it is getting there and whether that speed is beginning to slow down (decelerate) or speed up (accelerate), providing a clearer picture of potential trend reversals or continuations.
//+------------------------------------------------------------------+
//|                                                MACD-OsMA(AM).mq4 |
//|                                               Andrey Matvievskiy |
//|                                                                  |
//+------------------------------------------------------------------+
#property copyright "Andrey Matvievskiy"
#property link      ""

//---- indicator settings
#property  indicator_separate_window
#property  indicator_buffers 7
#property  indicator_color1  Black
#property  indicator_color2  Black
#property  indicator_color3  Aqua
#property  indicator_color4  Magenta
#property  indicator_color5  Green
#property  indicator_color6  Red
#property  indicator_color7  Black

extern int FastPeriod   = 12;
extern int SlowPeriod   = 26;
extern int SignalPeriod = 9;

extern int FastMethod   = 1;
extern int SlowMethod   = 1;
extern int SignalMethod = 0;

extern int FastShift   = 0;
extern int SlowShift   = 0;
extern int SignalShift = 0;

extern int FastPrice = 0;
extern int SlowPrice = 0;

extern int TF = 0;

//---- indicator buffers
double     ExtBuffer0[];
double     ExtBuffer1[];
double     ExtBuffer2[];
double     ExtBuffer3[];
double     ExtBuffer4[];
double     ExtBuffer5[];
double     ExtBuffer6[];
//+------------------------------------------------------------------+
//| Custom indicator initialization function                         |
//+------------------------------------------------------------------+
int init()
  {
//---- 2 additional buffers are used for counting.
   IndicatorBuffers(7);
//---- drawing settings

   SetIndexStyle(0,DRAW_NONE);
   SetIndexStyle(1,DRAW_NONE);
   SetIndexStyle(2,DRAW_HISTOGRAM,4,4);
   SetIndexStyle(3,DRAW_HISTOGRAM,4,4);
   SetIndexStyle(4,DRAW_HISTOGRAM,2,2);
   SetIndexStyle(5,DRAW_HISTOGRAM,2,2);
   SetIndexStyle(6,DRAW_NONE);
   IndicatorDigits(Digits+2);

//---- 4 indicator buffers mapping
   SetIndexBuffer(0,ExtBuffer0);
   SetIndexBuffer(1,ExtBuffer1);
   SetIndexBuffer(2,ExtBuffer2);
   SetIndexBuffer(3,ExtBuffer3);
   SetIndexBuffer(4,ExtBuffer4);
   SetIndexBuffer(5,ExtBuffer5);
   SetIndexBuffer(6,ExtBuffer6);

//---- name for DataWindow and indicator subwindow label
   IndicatorShortName("MACD-OsMA(AM) (TF "+TF+") ("+FastPeriod+","+SlowPeriod+","+SignalPeriod+")");

   SetIndexLabel(0,NULL);
   SetIndexLabel(1,NULL);

   SetIndexLabel(2,"OsMA+");
   SetIndexLabel(3,"OsMA-");
   SetIndexLabel(4,"MACD+");
   SetIndexLabel(5,"MACD-");

   SetIndexLabel(6,NULL);
   SetIndexLabel(7,NULL);
//---- initialization done
   return(0);
  }
//+------------------------------------------------------------------+
//| Accelerator/Decelerator Oscillator                               |
//+------------------------------------------------------------------+
int start()
  {
   int    limit;
   int    counted_bars=IndicatorCounted();
   double prev1,current1,prev2,current2;
   if(counted_bars>0) counted_bars--;
   limit=Bars-counted_bars;
      for(int i=0; i<limit; i++)
      ExtBuffer0[i]=iMA(NULL,TF,FastPeriod,FastShift,FastMethod,FastPrice,i)-iMA(NULL,TF,SlowPeriod,SlowShift,SlowMethod,SlowPrice,i);
      for(i=0; i<limit; i++)
      ExtBuffer1[i]=iMAOnArray(ExtBuffer0,Bars,SignalPeriod,SignalShift,SignalMethod,i);
      bool up1=true;
      bool up2=true;
      for(i=limit-1; i>=0; i--)
     {

      current1=ExtBuffer0[i];
      prev1=ExtBuffer0[i+1];
      if(current1>prev1) up1=true;
      if(current1<prev1) up1=false;
      if(!up1)
        {
         ExtBuffer5[i]=current1;
         ExtBuffer4[i]=0.0;
        }
      else
        {
         ExtBuffer4[i]=current1;
         ExtBuffer5[i]=0.0;
        }

      current2=ExtBuffer0[i]-ExtBuffer1[i];
      prev2=ExtBuffer0[i+1]-ExtBuffer1[i+1];
      if(current2>prev2) up2=true;
      if(current2<prev2) up2=false;
      if(!up2)
        {
         ExtBuffer3[i]=current2;
         ExtBuffer2[i]=0.0;
        }
      else
        {
         ExtBuffer2[i]=current2;
         ExtBuffer3[i]=0.0;
        }
         ExtBuffer6[i]=current2;
     }

   //---- done
   return(0);
  }
//+------------------------------------------------------------------+
Comments