Macd_Support_and_Resistance
Download script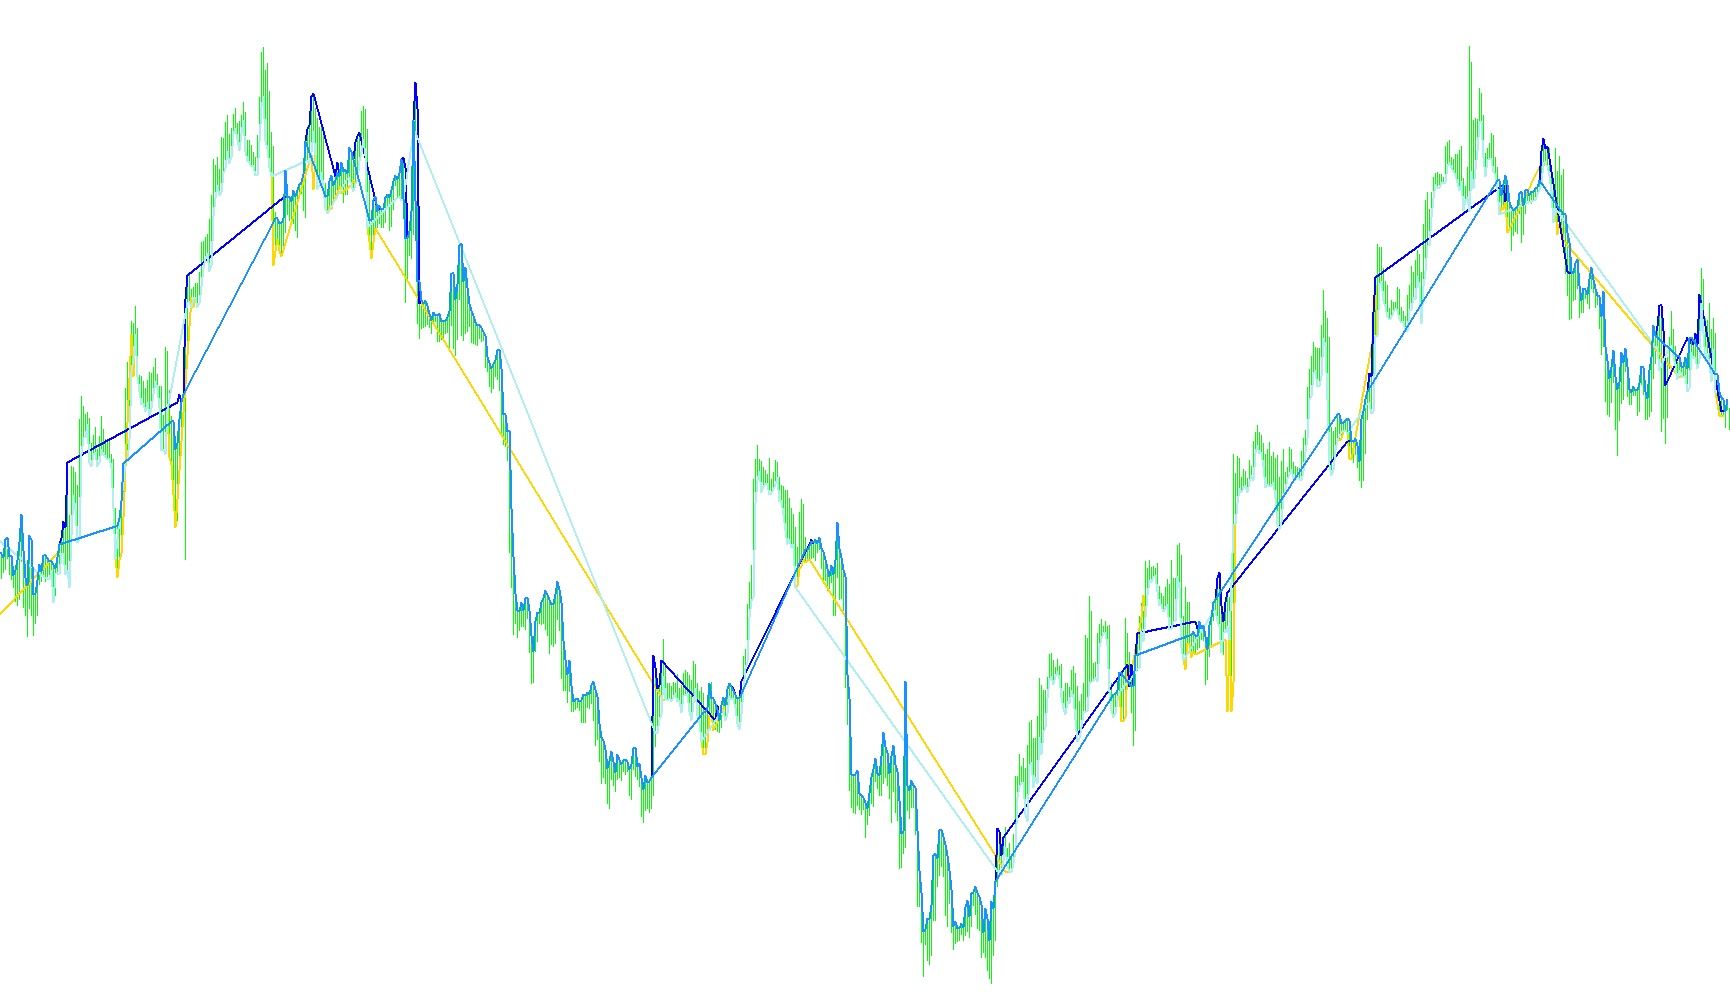
This script is designed to identify key price levels on a trading chart by analyzing the relationship between price action and the Moving Average Convergence Divergence (MACD) indicator. Instead of simply showing the MACD values in a separate window, this tool translates those mathematical signals directly onto your price candles to highlight potential zones of interest.
Core Functionality
The primary purpose of this script is to automatically plot Support and Resistance levels. It acts as a visual guide, helping traders identify areas where the price might encounter difficulty moving further in a specific direction. By using different "modes" of the MACD (Signal and Main), it creates a multi-layered view of these boundaries.
How the Logic Works
The script processes the market data by checking two distinct types of signals:
1. Primary Support and Resistance (Signal Mode) The tool first looks at the "Signal" component of the MACD based on the highest and lowest prices reached during a specific period.
- Resistance: When the logic detects a specific momentum shift regarding the low prices, it marks that level as a potential ceiling (Resistance).
- Support: When the logic detects a similar shift regarding the high prices, it marks that level as a potential floor (Support).
2. Secondary Support and Resistance (Main Mode) To provide a deeper analysis, the script performs a second set of calculations using the "Main" component of the MACD. This creates two additional, secondary lines on your chart. These serve as supplementary indicators, allowing you to see how the broader momentum aligns with the immediate signal levels.
Visual Representation
The script populates your chart with four distinct visual elements:
- Solid Lines: These represent the primary Support and Resistance zones derived from the Signal mode. They are intended to be the main focus for identifying major price boundaries.
- Dotted Lines: These represent the secondary "Resistance1" and "Support1" levels derived from the Main mode. They provide an extra layer of confirmation or a "buffer zone" for your analysis.
Summary for the User
In simple terms, this tool takes complex momentum math (MACD) and converts it into easy-to-read lines on your price chart. It tells you: "Based on recent price trends and momentum, here is where the market has shown strength or weakness in the past." This allows you to see potential trading "walls" (Resistance) and "floors" (Support) clearly without having to manually calculate indicators or interpret complex oscillator values.
//+------------------------------------------------------------------+
//|                                  Macd Support and Resistance.mq4 |
//|                                        http://www.metaquotes.net |
//+------------------------------------------------------------------+
#property copyright "Alksnis Gatis"
#property link      "2xpoint@gmail.com"

#property indicator_chart_window
#property indicator_buffers 4
#property indicator_color1 Violet
#property indicator_color2 Lime
#property indicator_color3 Red
#property indicator_color4 Blue
extern string x="macd option";
extern int FEMA    =8;
extern int SEMA    =24;
extern int SMA     =10;
extern string x2="timeframe- 0=current";
extern int PERIOD=0;
extern string x3="variant -100  100";
extern int variant=-2;
//---- buffers
double g1[];
double g2[];
double g3[];
double g4[];
double val1;
double val2;
double val3;
double val4;
int i;
//+------------------------------------------------------------------+
//|                                                                  |
//+------------------------------------------------------------------+
int init()
  {
   IndicatorBuffers(4);
//---- drawing settings
   SetIndexArrow(0,158);
   SetIndexArrow(1,158);
//----
   SetIndexStyle(0,DRAW_SECTION,STYLE_SOLID,2);
   //SetIndexDrawBegin(0,i-1);
   SetIndexBuffer(0,g1);
   SetIndexLabel(0,"Resistance");
//----
   SetIndexStyle(1,DRAW_SECTION,STYLE_SOLID,2);
   //SetIndexDrawBegin(1,i-1);
   SetIndexBuffer(1,g2);
   SetIndexLabel(1,"Support");

//---- drawing settings
   SetIndexArrow(2,158);
   SetIndexArrow(3,158);
//----
   SetIndexStyle(2,DRAW_SECTION,STYLE_DOT,2);
   //SetIndexDrawBegin(2,i-1);
   SetIndexBuffer(2,g3);
   SetIndexLabel(2,"Resistance1");
//----
   SetIndexStyle(3,DRAW_SECTION,STYLE_DOT,2);
   //SetIndexDrawBegin(3,i-1);
   SetIndexBuffer(3,g4);
   SetIndexLabel(3,"Support1");

//----
   return(0);
  }
//+------------------------------------------------------------------+
//|                                                                  |
//+------------------------------------------------------------------+
int start()
  {
   int counted_bars = IndicatorCounted();
   if(counted_bars < 0)  return(-1);
   if(counted_bars > 0)   counted_bars--;
   int limit = Bars - counted_bars;
   if(counted_bars==0) limit-=1+1+MathAbs(variant);
   i=limit;

   while(i+variant>=0)
     {
      //1
      val1=iMACD(NULL,PERIOD,FEMA,SEMA,SMA,PRICE_LOW,MODE_SIGNAL,i);

      if(val1>0)
         g1[i]=Low[i];
      else
         g1[i]=g1[i+variant];
      //2
      val2=iMACD(NULL,PERIOD,FEMA,SEMA,SMA,PRICE_HIGH,MODE_SIGNAL,i);

      if(val2<0)
         g2[i]=High[i];
      else
         g2[i]=g2[i+variant];
      //3
      val3=iMACD(NULL,PERIOD,FEMA,SEMA,SMA,PRICE_LOW,MODE_MAIN,i);

      if(val3>0)
         g3[i]=Low[i];
      else
         g3[i]=g3[i+variant+1];
      //2
      val4=iMACD(NULL,PERIOD,FEMA,SEMA,SMA,PRICE_HIGH,MODE_MAIN,i);

      if(val4<0)
         g4[i]=High[i];
      else
         g4[i]=g4[i+variant+1];
      i--;

     }
   return(0);
  }
//+------------------------------------------------------------------+
Comments