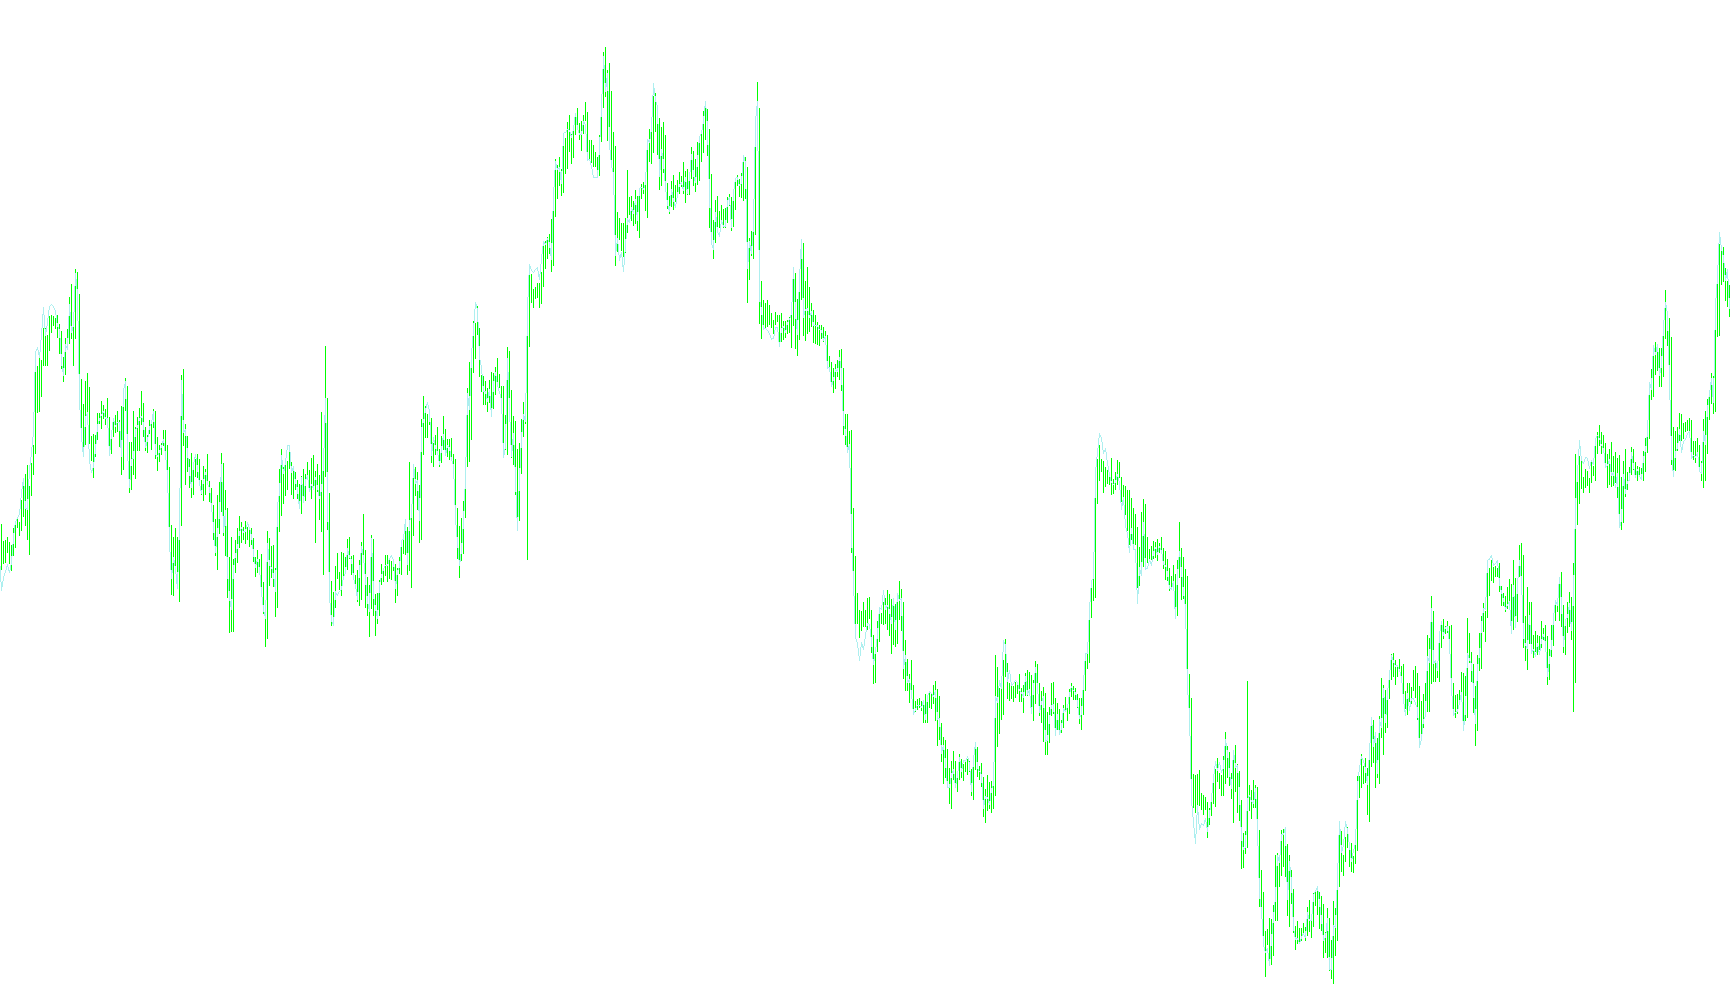
This custom trading indicator is designed to provide traders with a visual representation of market momentum by analyzing the relationship between different price averages. Rather than just showing the raw price, it processes data to highlight trends, potential reversals, and the underlying strength of current price movements.
Core Logic Overview
The indicator operates by calculating three distinct layers of data derived from the closing prices of the asset:
1. The Momentum Gap (MACD Line) The script starts by comparing two different "moving averages." These are essentially smoothed versions of the price history that track how fast and in what direction the price is moving over specific periods. By subtracting a slower average from a faster one, the tool identifies the gap between short-term momentum and long-term trends. When this gap widens, it suggests a strengthening trend; when it narrows, it may indicate a cooling of momentum.
2. The Signal Baseline To help filter out "noise" and provide clearer directions, the script takes the data from the Momentum Gap mentioned above and performs a second calculation on it. This creates a secondary "signal line." Traders typically look at how the Momentum Gap interacts with this signal line—for instance, when the gap crosses above or below this baseline, it can act as a cue for potential changes in market direction.
3. The Modified Histogram Finally, the script calculates a unique visual component known as a histogram. While standard histograms usually only show the difference between the Momentum Gap and the Signal Baseline, this specific logic adds the current closing price into the calculation. This creates a customized visual representation that combines the relationship between momentum trends with the actual current market value, providing a more complex picture of where the price is currently sitting in relation to its historical trend.
Summary for Traders
Instead of looking at simple price candles, this tool automates the heavy lifting of comparing multiple timeframes simultaneously. It transforms raw price history into three data points that help you visualize:
- The current speed and strength of a trend.
- A smoothed signal to help identify turning points.
- A unique combined visual (the histogram) that balances momentum with actual closing prices.
//---- indicator settings
#property  indicator_chart_window
#property  indicator_buffers 3
#property  indicator_color1  Red
#property  indicator_width1  2
//---- indicator parameters
extern int FastEMA=12;
extern int SlowEMA=26;
extern int SignalSMA=9;
//---- indicator buffers
double     MacdBuffer[];
double     SignalBuffer[];
double     HistoBuffer[];

//+------------------------------------------------------------------+
//| Custom indicator initialization function                         |
//+------------------------------------------------------------------+
int init()
  {
//---- drawing settings
   SetIndexStyle(0,DRAW_NONE);
   SetIndexStyle(1,DRAW_NONE);
   SetIndexStyle(2,DRAW_LINE);
   SetIndexDrawBegin(1,SignalSMA);
   IndicatorDigits(Digits+1);
//---- indicator buffers mapping
   SetIndexBuffer(0,MacdBuffer);
   SetIndexBuffer(1,SignalBuffer);
   SetIndexBuffer(2,HistoBuffer);
//---- name for DataWindow and indicator subwindow label
   IndicatorShortName("MACD("+FastEMA+","+SlowEMA+","+SignalSMA+")    !! :)");
   SetIndexLabel(0,"MACD YO");
   SetIndexLabel(1,"Signal YO");
   SetIndexLabel(2,"H I S T O :):)");
//---- initialization done
   return(0);
  }
//+------------------------------------------------------------------+
//| Moving Averages Convergence/Divergence                           |
//+------------------------------------------------------------------+
int start()
  {
   int limit;
   int counted_bars=IndicatorCounted();
//---- last counted bar will be recounted
   if(counted_bars>0) counted_bars--;
   limit=Bars-counted_bars;
//---- macd counted in the 1-st buffer
   for(int i=0; i<limit; i++)
      MacdBuffer[i]=iMA(NULL,0,FastEMA,0,MODE_EMA,PRICE_CLOSE,i)-iMA(NULL,0,SlowEMA,0,MODE_EMA,PRICE_CLOSE,i);
//---- signal line counted in the 2-nd buffer
   for(i=0; i<limit; i++)
      SignalBuffer[i]=iMAOnArray(MacdBuffer,Bars,SignalSMA,0,MODE_SMA,i);
//---- histogram line counted in the 3-nd buffer
   for(i=0; i<limit; i++)
      HistoBuffer[i]=MacdBuffer[i]-SignalBuffer[i]+Close[i];
//---- done
   return(0);
  }
//+------------------------------------------------------------------+
Comments