Mass_Index
Download script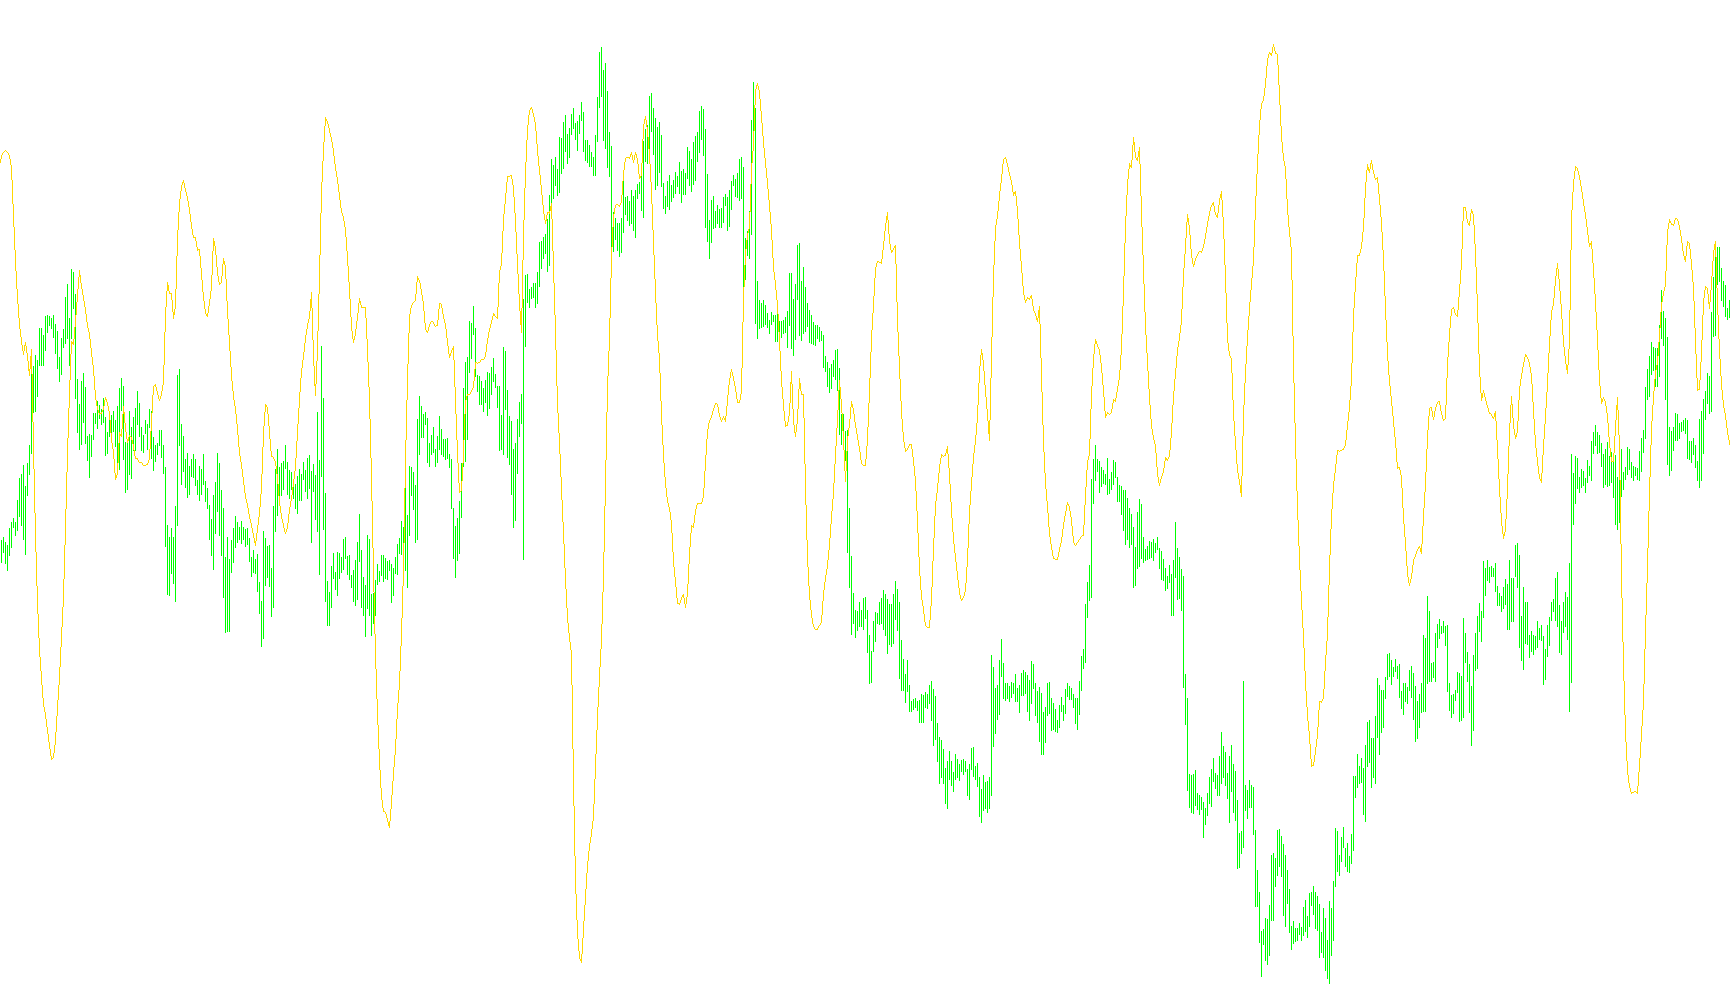
The Mass Index is a technical analysis tool designed to provide traders with insights into market volatility and momentum by analyzing the relationship between price extremes. Unlike standard indicators that might simply track the closing price, this script focuses on the "range" of price movement over specific periods to identify significant shifts in market behavior.
How the Logic Works
The indicator operates through a multi-step mathematical progression to filter out market "noise" and highlight meaningful trends:
- Range Calculation: The process begins by calculating the difference between the highest price (High) and the lowest price (Low) for every candle on the chart. This identifies the total volatility of each individual bar.
- Smoothing the Volatility: To prevent the data from being too erratic, the script applies an Exponential Moving Average (EMA) to those high-low ranges. This creates a smoother representation of how much the price is swinging over a set period.
- Relative Strength Ratio: The logic then takes that smoothed average and divides it by another moving average of the same data. This step is crucial as it measures the relative change in volatility, helping to determine if the current price action is accelerating or decelerating compared to recent history.
- Final Index Calculation: Finally, the script applies a Simple Moving Average (SMA) to this ratio and multiplies it by a specific factor. The result is plotted as a line on a separate window below your main chart.
What This Means for the Trader
The ultimate goal of this logic is to produce a "Mass Index" line. Because the indicator is built on nested averages:
- Trend Identification: It helps in identifying whether the current momentum is expanding or contracting.
- Volatility Filtering: By using multiple layers of averaging (EMA and SMA), the script attempts to ignore minor, insignificant price flickers, focusing instead on broader market movements.
- Visual Cues: The tool provides a visual representation of "market mass." When the index moves significantly, it suggests that the underlying volatility is shifting in a way that may precede a trend change or a continuation.
Indicators Used
Miscellaneous
15
Views
0
Downloads
0
Favorites
Mass_Index
//+------------------------------------------------------------------+
//|                                                   Mass Index.mq4 |
//|                      Copyright © 2007, MetaQuotes Software Corp. |
//|                                        http://www.metaquotes.net |
//+------------------------------------------------------------------+
#property copyright "Copyright © 2007, MetaQuotes Software Corp."
#property link      "http://www.metaquotes.net"
//----
#property  indicator_separate_window
#property indicator_buffers 1
#property indicator_color1 Blue
#property indicator_level1 27
#property indicator_level2 26.5
#property indicator_levelcolor Blue
//---- input parameters
extern int  EMAPeriod = 9;
extern int  SecondPeriod = 9;
extern int  SumPeriod = 25;
//---- buffers
double MI[];
double HL[];
double HLaverage[];
double EMA2[];
//+------------------------------------------------------------------+
//| Custom indicator initialization function                         |
//+------------------------------------------------------------------+
int init()
  {
//---- indicators
   string name;
   name = "Mass Index(" + EMAPeriod + "," + SecondPeriod + "," + SumPeriod + ")";
   IndicatorBuffers(4);
   SetIndexStyle(0, DRAW_LINE);
   SetIndexBuffer(0, MI);
   SetIndexLabel(0, name);
   SetIndexEmptyValue(0, 0.0);
   SetIndexBuffer(1, HL);
   SetIndexEmptyValue(1, 0.0);
   SetIndexBuffer(2, HLaverage);
   SetIndexEmptyValue(2, 0.0);
   SetIndexBuffer(3, EMA2);
   SetIndexEmptyValue(3, 0.0);
   IndicatorShortName(name);
   IndicatorDigits(2);
//----
   return(0);
  }
//+------------------------------------------------------------------+
//| Custom indicator deinitialization function                       |
//+------------------------------------------------------------------+
int deinit()
  {
//----
   return(0);
  }
//+------------------------------------------------------------------+
//| Custom indicator iteration function                              |
//+------------------------------------------------------------------+
int start()
  {
   int counted_bars = IndicatorCounted();
   int limit,i;
//----
   if(counted_bars < 0)
      return(-1);
   if(counted_bars == 0)
     {
       limit = Bars - 1;
       for(i = limit; i >= 0; i--)
           HL[i] = High[i] - Low[i];
       for(i = limit - EMAPeriod; i >= 0; i--)
           HLaverage[i]=iMAOnArray(HL,0,EMAPeriod,0,MODE_EMA,i);
       for(i = limit - EMAPeriod - SecondPeriod; i >= 0; i--)
           EMA2[i] = HLaverage[i] / iMAOnArray(HLaverage, 0, SecondPeriod, 0, MODE_EMA, i);
       for(i = limit - EMAPeriod - SecondPeriod - SumPeriod; i >= 0; i--)
           MI[i] = iMAOnArray(EMA2, 0, SumPeriod, 0, MODE_SMA, i)*SumPeriod;
     }
   if(counted_bars > 0)
     {
       limit = Bars - counted_bars;
       for(i = limit; i >= 0; i--)
           HL[i] = High[i] -Low[i];
       for(i = limit; i >= 0; i--)
           HLaverage[i] = iMAOnArray(HL, 0, EMAPeriod, 0, MODE_EMA, i);
       for(i = limit; i >= 0; i--)
           EMA2[i] = HLaverage[i] / iMAOnArray(HLaverage, 0, SecondPeriod, 0, MODE_EMA, i);
       for(i = limit; i >= 0; i--)
           MI[i] = iMAOnArray(EMA2, 0, SumPeriod, 0, MODE_SMA, i)*SumPeriod;
     }
//----
   return(0);
  }
//+------------------------------------------------------------------+
Comments