mikko_mtf_candle
Download script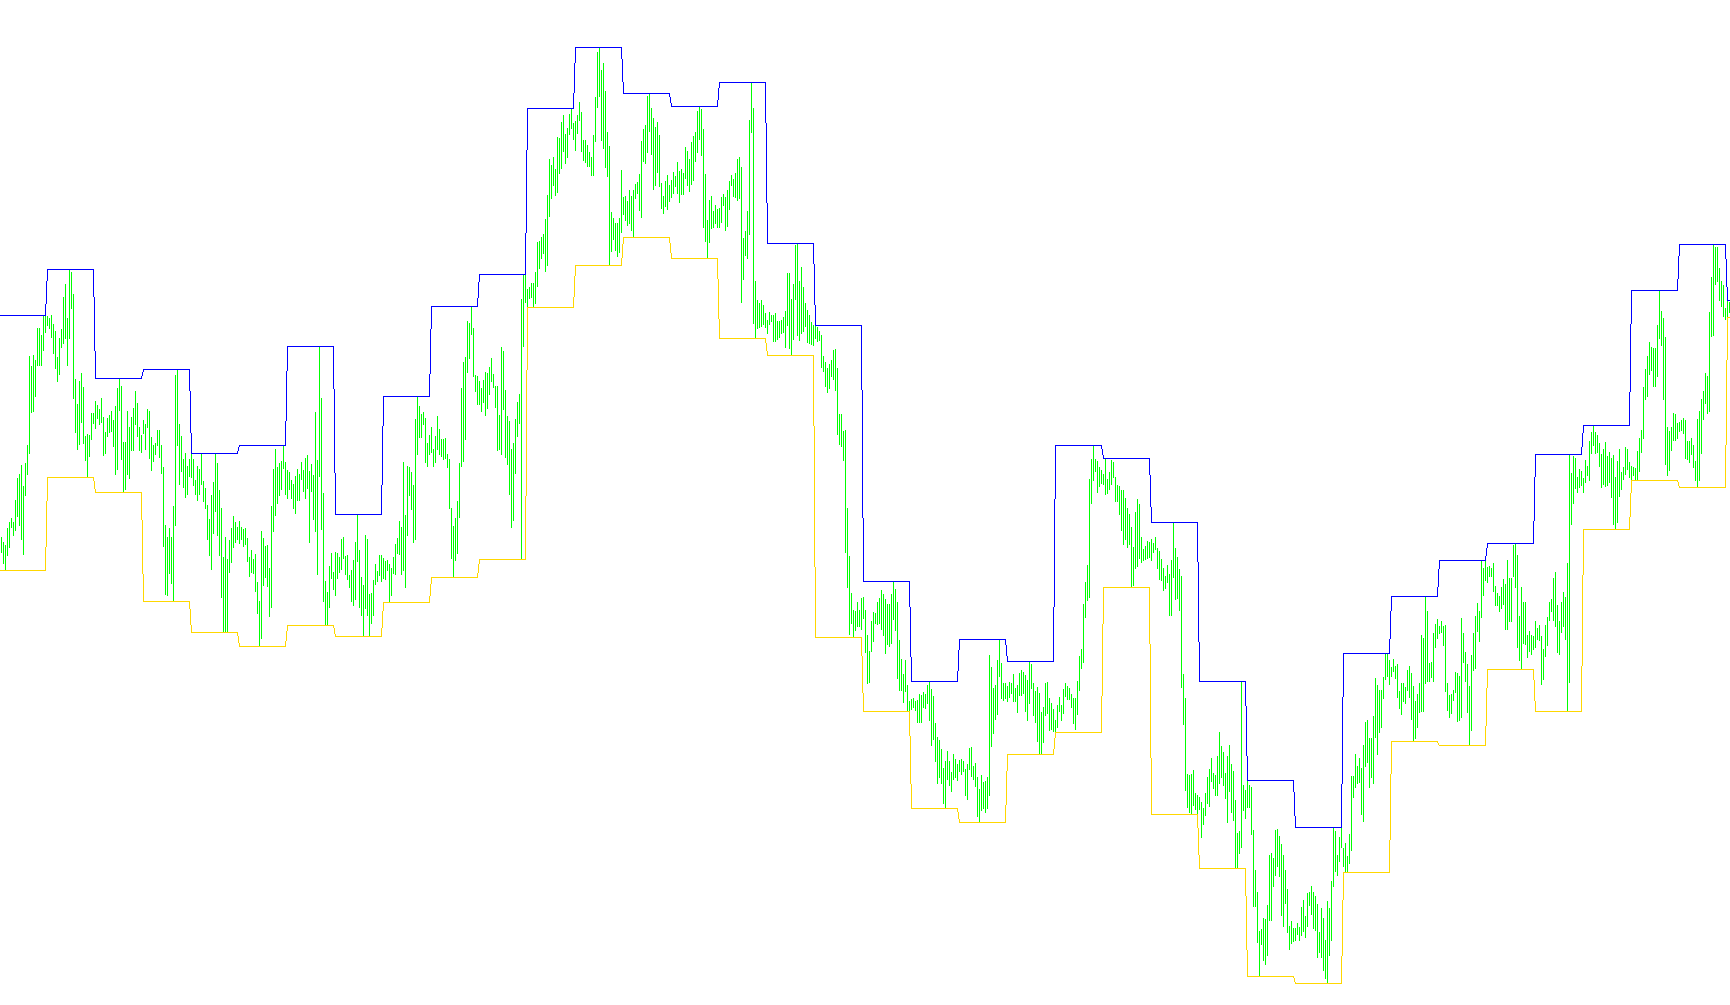
This tool is designed to simplify how traders visualize significant price boundaries by projecting higher timeframe data directly onto a lower timeframe chart. Essentially, it allows you to see the "big picture" without constantly switching between different time layouts.
How the Logic Works
The core functionality of this script is Multi-Timeframe Data Overlay. Here is a breakdown of how the logic processes your trading screen:
- Timeframe Selection: The script allows you to select a specific larger timeframe (such as a Daily chart) to act as your primary reference point. It then identifies the price data from that larger period and "maps" it onto the smaller timeframe chart you are currently viewing (such as a 1-hour or 15-minute chart).
- Dynamic Price Tracking: The script constantly scans the history of the asset. For every candle on your current small timeframe, it looks backward to find the corresponding candle on the larger timeframe you selected.
- High and Low Identification: Once it identifies the correct historical data point from the larger timeframe, it extracts two specific pieces of information: the highest price reached (High) and the lowest price reached (Low).
- Visual Mapping: Finally, it draws these high and low points as lines on your current chart. This means that while you are trading in a fast-moving environment, you can see exactly where the boundaries were set by the larger market movements.
Key Benefit for Traders
Instead of manually checking what the Daily Highs or Lows were and trying to remember them, this script automates that process. It provides a visual "overlay" of major structural levels, helping you identify support and resistance zones based on higher-level market trends while you execute trades on shorter, more active price movements.
Price Data Components
Miscellaneous
11
Views
0
Downloads
0
Favorites
mikko_mtf_candle
//+---------------------------------------------------------------+
//|                                                    MTF candle |
//|                                   http://www.currencylabs.com |
//|                                                 (C) _mikkom   |
//+---------------------------------------------------------------+
#property copyright "Mikko"
#property link      "noneOfYOurBusiness"

//#property indicator_separate_window
#property indicator_chart_window
#property indicator_buffers 2
#property indicator_color1 Gray
#property indicator_color2 Gray

double high[];
double low[];

extern int period = PERIOD_D1;

int init() {

   IndicatorBuffers(2);
   SetIndexBuffer(0, low);
   SetIndexStyle(0, DRAW_LINE, EMPTY, 1);

   SetIndexBuffer(1, high);
   SetIndexStyle(1, DRAW_LINE, EMPTY, 1);

   IndicatorShortName("Mikko candle "+period);

   if(period == 0)
      period = Period();

   return(0);
}

int deinit() {
   return(0);
}

int start() {

   int counted_bars=IndicatorCounted();

   if(Period() >= period)
      return;

   if(counted_bars < 0)
       return(-1);
   if(counted_bars > 0)
       counted_bars--;

   int limit = Bars - counted_bars;

   if((Low[0] < low[0] || High[0] > high[0]) && limit < period)
      limit = period;

   for(int i = limit; i >= 0; i--) {

       int t = iBarShift(Symbol(), period, Time[i], false);

       low[i] = iLow(Symbol(),period,t);
       high[i] = iHigh(Symbol(),period,t);
   }
   return(0);
}
Comments