MP Overlay
Download script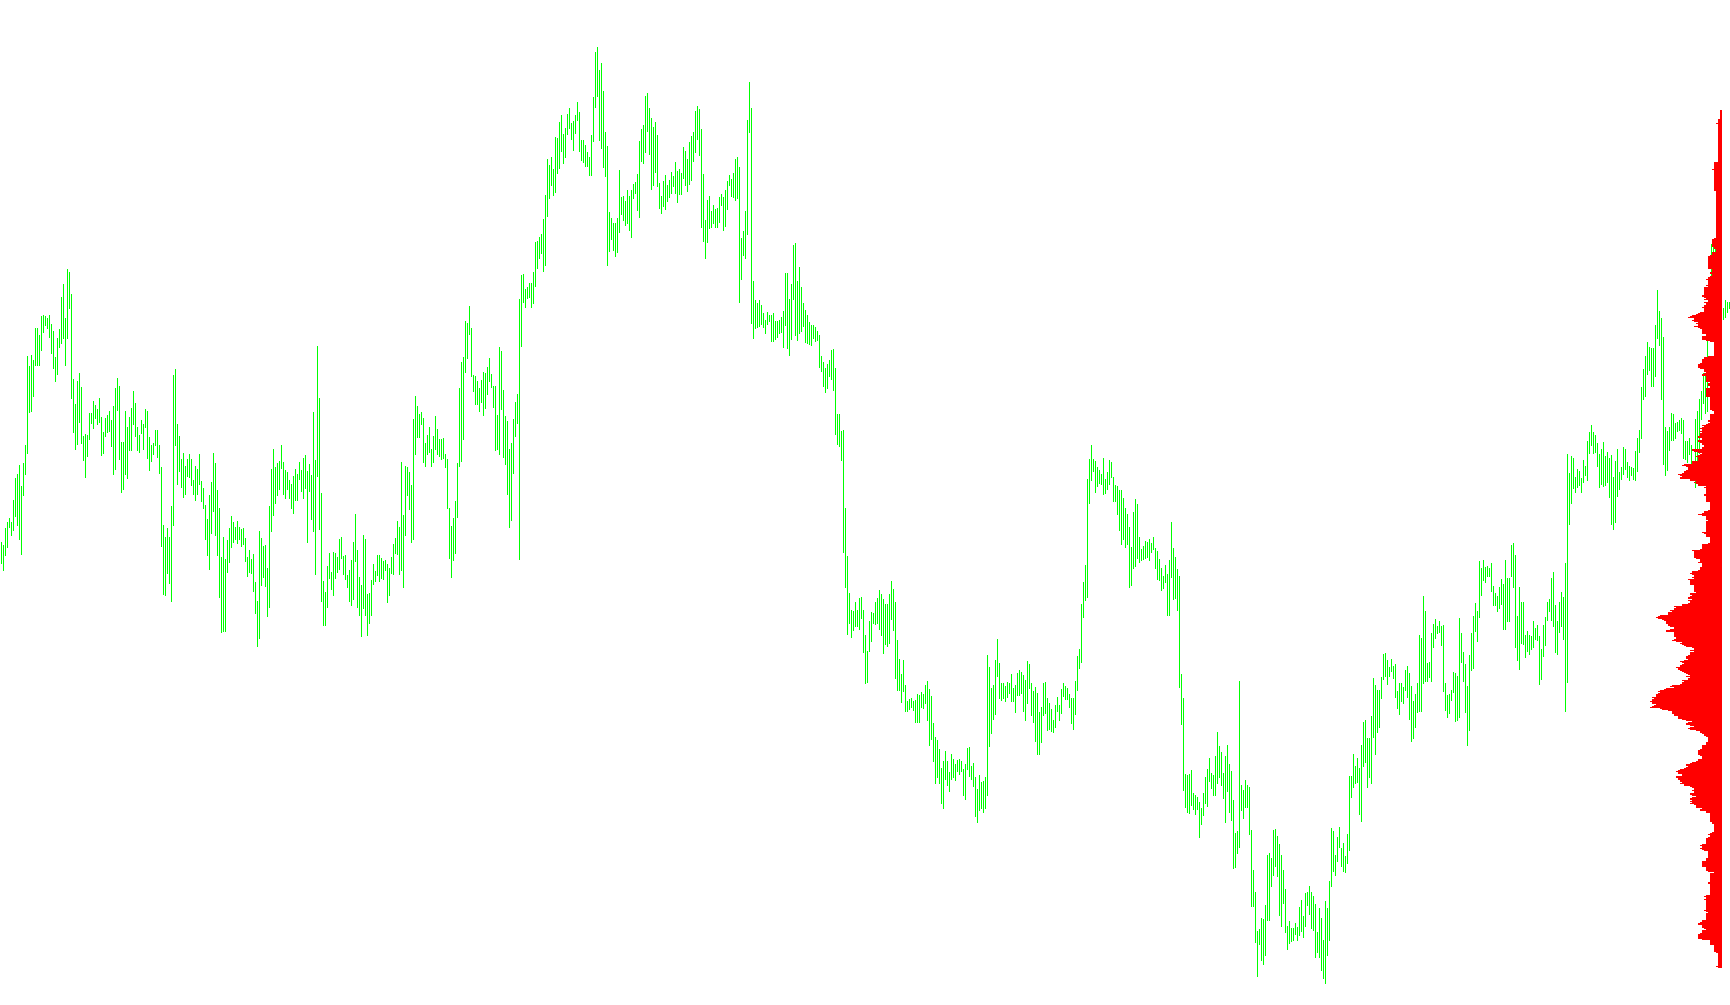
This script is designed to analyze historical price action and visually map out the "density" of price movement on your trading chart. Instead of just showing you where the price went, it identifies which specific price levels were visited most frequently during a set period in the past.
How the Logic Works
1. Data Collection and Range Identification The tool first looks back at a specific amount of historical data (which you can customize). It scans every individual candle within that timeframe to identify two critical boundaries:
- The highest price reached (the "ceiling").
- The lowest price reached (the "floor").
By establishing these boundaries, the script creates a map of the entire price zone explored during that history.
2. Price Density Mapping Once the boundaries are set, the script breaks down the space between the "floor" and the "ceiling" into small, measurable steps. It then re-scans the historical data to see how often the price occupied each specific step.
Think of this like a heat map: if the price moved back and forth across a specific level many times, that level is flagged as having high activity. If the price skipped over a zone quickly, that area is marked as having low activity.
3. Visual Representation Finally, the script translates this mathematical data into a visual layout on your chart. For every price level identified in your range, it draws a horizontal trend line.
The length of these lines is determined by the volume of activity at that specific price. A longer line indicates a "high-traffic" zone where the market spent significant time consolidating or reacting, while shorter lines represent areas where the price moved through more rapidly.
Key Benefits for the User
- Identify Support and Resistance: By seeing where the most activity occurred, you can visually identify "heavy" price zones that may act as significant barriers in the future.
- Market Context: It provides an instant snapshot of where the "battleground" was during the previous historical period.
- Automated Analysis: The script does the heavy lifting of scanning hundreds of candles and calculating density automatically, providing a clear visual summary without requiring manual calculation.
//+------------------------------------------------------------------+
//|                                                 Level Sensor.mq4 |
//|                                          Copyright © 2005, Sfen. |
//+------------------------------------------------------------------+
#property copyright "Copyright © 2005, Sfen"
#property indicator_chart_window
//---- input parameters
extern int       MAX_HISTORY=500;
extern int       STEP = 1;
int init()
  {
   return(0);
  }
double CSH(int shift)
{
 return (MathMax(Open[shift],Close[shift]));
}
double CSL(int shift)
{
 return (MathMin(Open[shift],Close[shift]));
}
string OBJECT_PREFIX = "LEVELS";
int ObjectId = 0;
string IntToStr(int X)
{
 return (DoubleToStr(X,0));
}
string ObGetUniqueName(string Prefix)
{
 ObjectId++;
 return (Prefix+" "+IntToStr(ObjectId));
}
void   ObDeleteObjectsByPrefix(string Prefix)
{
 int L = StringLen(Prefix);
 int i=0;
 while (i<ObjectsTotal())
 {
  string ObjName = ObjectName(i);
  if (StringSubstr(ObjName,0,L)!=Prefix) { i++; continue;}
  ObjectDelete(ObjName);
 }
}
int deinit()
  {
   ObDeleteObjectsByPrefix(OBJECT_PREFIX);
   return(0);
  }
int start()
  {
   string S;
   ObDeleteObjectsByPrefix(OBJECT_PREFIX);
   double HH = 0;
   double LL = 1000000;
   int History = MathMin(Bars,MAX_HISTORY);

   int i, j, k;
   for (i=1; i<History; i++)
   {
    HH = MathMax(HH,CSH(i));
    LL = MathMin(LL,CSL(i));
   }
   int NumberOfPoints = (HH-LL)/(1.0*Point*STEP)+1;
   int Count[];
   ArrayResize(Count,NumberOfPoints);

   for (i=0; i<NumberOfPoints; i++) Count[i]=0;
   for (i=1; i<History; i++)
   {
    double C = CSL(i);
    while (C<CSH(i))
    {
     int Index = (C-LL)/(1.0*Point*STEP);
     Count[Index]++;
     C += 1.0*Point*STEP;
    }
   }

   for (i=0; i<NumberOfPoints; i++)
   {
    double StartX = Time[5];
    double StartY = LL + 1.0*Point*STEP*i;
    double EndX   = Time[5+Count[i]];
    double EndY   = StartY;

    string ObjName = ObGetUniqueName(OBJECT_PREFIX);
    ObjectDelete(ObjName);
    ObjectCreate(ObjName,OBJ_TREND,0,StartX,StartY,EndX,EndY);
    ObjectSet(ObjName,OBJPROP_RAY,0);
    ObjectSet(ObjName,OBJPROP_COLOR,Red);

   }
   return(0);
  }
//+------------------------------------------------------------------+
Comments