MT4-Psychological_v1
Download script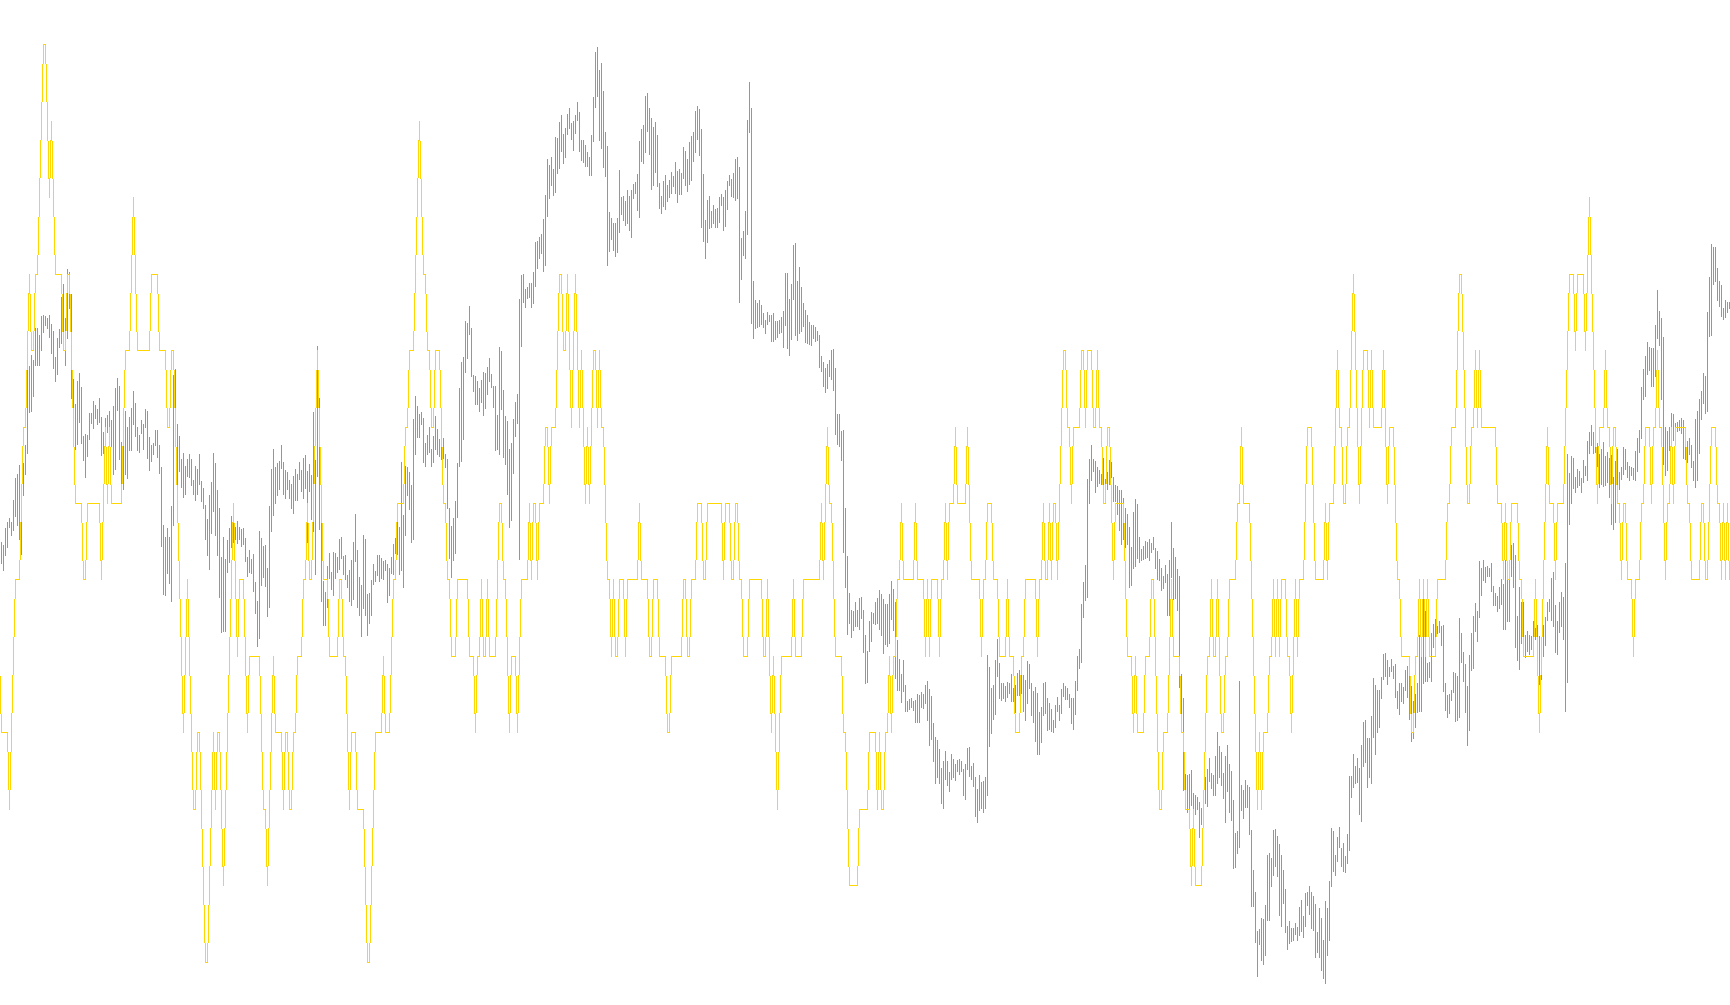
Overview
The Psychological Indicator is a specialized trading tool designed to track market sentiment by analyzing price momentum over a specific timeframe. By converting raw price action into a percentage-based score, it helps traders visualize whether the prevailing market trend is driven by bullish (買い) or bearish (売り) activity.
How the Logic Works
The indicator operates by examining a "lookback period"—a set number of previous candles (defaulting to 25)—to determine how often the price has closed higher than its preceding candle.
Here is the step-by-step breakdown of the calculation:
- Trend Counting: The script scans through the historical data for every candle. It identifies "upward" movements by checking if the closing price of a current candle is higher than the closing price of the one before it.
- Momentum Analysis: Each time an upward movement is detected within the specified lookback period, the internal counter increases. Conversely, it adjusts the count based on the boundary conditions of the timeframe to ensure a fluid transition of data as new candles form.
- Percentage Conversion: Once the total number of upward movements is tallied, the script converts this raw count into a percentage score relative to the total lookback period.
- Visual Output: This final percentage is plotted on a separate window in your trading platform.
Key Features and Visual Cues
The indicator uses three primary horizontal levels to help traders interpret market psychology:
- 50% Level (The Equilibrium): This acts as the midline. When the indicator is above 50, it suggests that upward momentum is dominant; below 50 indicates downward momentum is taking control.
- 75% and 25% Levels: These serve as "overextended" markers. When the value approaches 75, it suggests a very strong bullish sentiment (which may eventually lead to exhaustion), while a value approaching 25 suggests a dominant bearish sentiment.
Summary for Traders
Instead of looking at complex price spikes, this indicator provides a smoothed, readable percentage of "market mood." It allows you to see the cumulative strength of a trend over time, making it easier to identify when a market is becoming heavily biased in one direction or when momentum is beginning to shift.
//+------------------------------------------------------------------+
//|                                                                  |
//|               Psychological Indicator (Ported from FXAccucharts) |
//|                                                      Version 1.0 |
//|                     Copyright © 2007, Bruce Hellstrom (brucehvn) |
//|                                              bhweb@speakeasy.net |
//|                                         http://www.metaquotes.ru |
//+------------------------------------------------------------------+
//+--------------------------------------------------------------------------------+
//|  This indicator is ported from the FXAccuCharts platform to MT4. The formula   |
//|  used here has been tested on FXAccuCharts to insure it displays the same as   |
//|  their default psychological indicator.                                        |
//|                                                                                |
//| Input Parameters:                                                              |
//|  PsychPeriod - Lookback periods for the indicator (25 default)                 |
//|                                                                                |
//| Revision History                                                               |
//|    Version 1.0                                                                 |
//|    * Initial Revision                                                          |
//+--------------------------------------------------------------------------------+
#property copyright "Copyright © 2007, Bruce Hellstrom (brucehvn)"
#property link      "http: //www.metaquotes.net/"
//----
#property indicator_separate_window
#property indicator_buffers 1
#property indicator_color1 DodgerBlue
#property indicator_style1 STYLE_SOLID
//----
#property indicator_level1 50.0
#property indicator_level2 75.0
#property indicator_level3 25.0
#property indicator_levelcolor Silver
#property indicator_levelwidth 1
#property indicator_levelstyle STYLE_DOT
#define INDICATOR_VERSION "v1.0"
// Input Parameters
extern int PsychPeriod=25;
// Buffers
double PsychBuffer[];
// Other Variables
string ShortName;
int CountBuf[];
// Custom indicator initialization function
//+------------------------------------------------------------------+
//|                                                                  |
//+------------------------------------------------------------------+
  int init()
  {
   IndicatorBuffers( 1 );
   SetIndexStyle( 0, DRAW_LINE, STYLE_SOLID, 1 );
   SetIndexBuffer( 0, PsychBuffer );
   SetIndexDrawBegin( 0, PsychPeriod );
   ArraySetAsSeries( CountBuf, true );
   ShortName="Psychological-" + INDICATOR_VERSION + "(" + PsychPeriod + ")";
   IndicatorShortName( ShortName );
   SetIndexLabel( 0, ShortName );
   Print( ShortName );
   Print( "Copyright (c) 2007 - Bruce Hellstrom, bhweb@speakeasy.net" );
//----
   return( 0 );
  }
// Custom indicator deinitialization function
//+------------------------------------------------------------------+
//|                                                                  |
//+------------------------------------------------------------------+
  int deinit()
  {
   return( 0 );
  }
// Indicator Logic run on every tick
//+------------------------------------------------------------------+
//|                                                                  |
//+------------------------------------------------------------------+
  int start()
  {
   int counted_bars=IndicatorCounted();
   // Check for errors
     if(counted_bars < 0)
     {
      return( -1 );
     }
   // Last bar will be recounted
     if(counted_bars > 0)
     {
      counted_bars--;
     }
   // Resize the non-buffer array if necessary
     if(ArraySize( CountBuf)!= ArraySize( PsychBuffer))
     {
      ArraySetAsSeries( CountBuf, false );
      ArrayResize( CountBuf, ArraySize( PsychBuffer));
      ArraySetAsSeries( CountBuf, true );
     }
   // Get the upper limit
   int limit=Bars - counted_bars;
     for( int ictr=0; ictr < limit; ictr++)
     {
      int Count=0;
      int endctr=ictr + 1 + PsychPeriod;
        for( int jctr=ictr + 1; jctr < endctr; jctr++)
        {
           if(Close[jctr] > Close[jctr + 1])
           {
            Count++;
           }
        }
        if(Close[ictr] > Close[ictr + 1])
        {
         Count++;
        }
        if(Close[ictr + PsychPeriod] > Close[ictr + PsychPeriod + 1])
        {
         Count--;
        }
      double dCount=Count;
      PsychBuffer[ictr] =(dCount/PsychPeriod)* 100.0;
     }
//----
   return( 0 );
  }
//+------------------------------------------------------------------+
Comments