MTF_AbsoluteStrength_v1DHs
Download script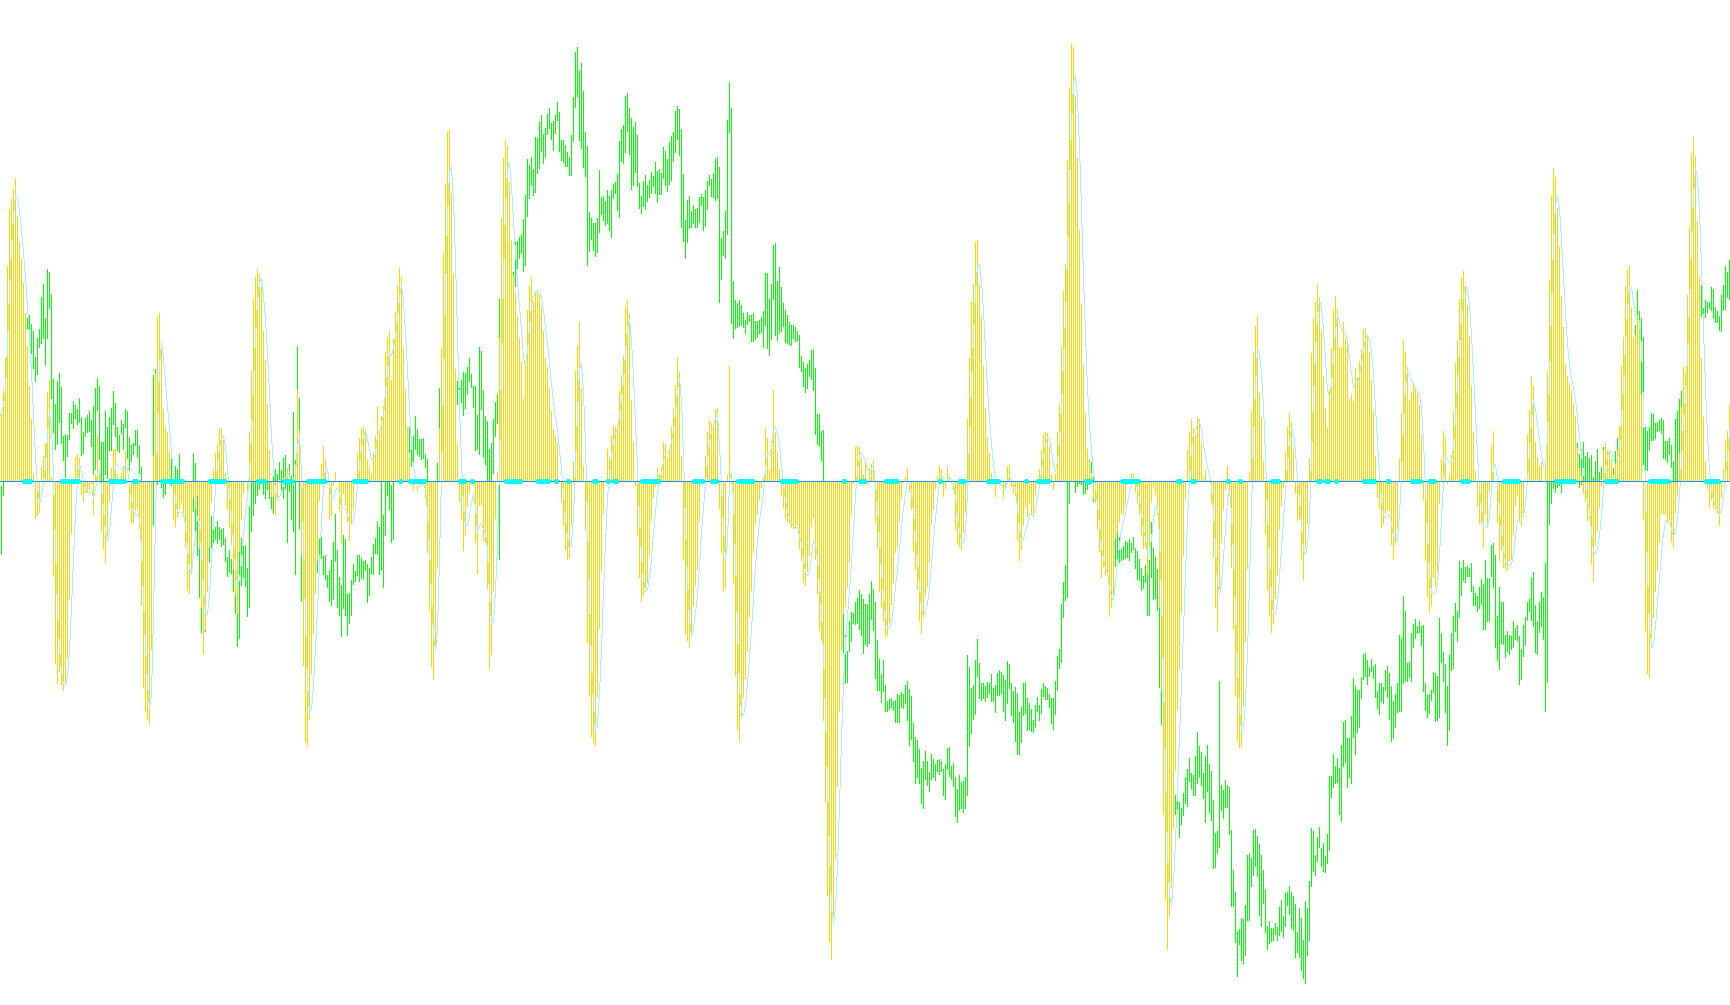
The MTF_AbsoluteStrength_v1DH is a multi-timeframe technical analysis tool designed to visualize market momentum and trend strength by consolidating data from different time periods into a single view. Instead of requiring you to switch between various charts (such as 1-hour, 4-hour, or Daily) to see the "big picture," this script pulls that information forward to your current screen.
Core Functionality
The script operates by calculating "Absolute Strength" metrics based on two primary methodologies: RSI (Relative Strength Index) and Stochastic oscillators. It measures the independent power of both buyers (Bulls) and sellers (Bears) to determine which side currently dominates the market.
Key Visual Elements
The indicator populates your trading platform with several distinct visual layers:
- Bull & Bear Strength: These are represented as histograms and lines that show the active momentum of buyers versus sellers.
- Signal Lines: The script generates specific signal lines for both bulls and bears, helping to identify potential shifts in momentum or exhaustion.
- No-Trade Zones: One of the most practical features of this script is the "No-Trade" indicator. It identifies periods where neither buyers nor sellers show sufficient strength to justify a clear move. When the market is indecisive (the "Yellow Dots"), it signals a zone where trading may be risky due to lack of momentum.
How it Works Internally
- Multi-Timeframe (MTF) Synchronization: The script allows you to define a specific timeframe (e.g., Daily) while staying on a lower timeframe chart (e.g., 15-minute). It automatically aligns the data so that the higher timeframe's strength is projected accurately onto your current price action.
- Customizable Smoothing: To prevent "noise" from affecting your view, the logic includes smoothing parameters. You can choose different types of Moving Averages (Simple, Exponential, Smoothed, or Linear Weighted) to refine how the strength data is presented.
- Data Consistency: The script includes a specialized "refresh" logic. This ensures that if you are looking at a small timeframe, the higher timeframe data remains consistent and stable across multiple bars, preventing the visual data from flickering or jumping erratically as new prices arrive.
Summary for the User
This tool is designed to give you a high-level overview of market dynamics. By combining multi-timeframe analysis with momentum oscillators, it helps you see whether the current price move is supported by strong "absolute" strength or if it is merely a weak fluctuation in an otherwise undecided market.
//+------------------------------------------------------------------+
//|                    (Diff_Hist)    MTF_AbsoluteStrength_v1DH .mq4 |
//|                           Copyright © 2006, TrendLaboratory Ltd. |
//|            http://finance.groups.yahoo.com/group/TrendLaboratory |
//|                                       E-mail: igorad2004@list.ru |
//+------------------------------------------------------------------+
#property copyright "Copyright © 2006, TrendLaboratory Ltd."
#property link      "http://finance.groups.yahoo.com/group/TrendLaboratory"

#property indicator_separate_window
#property indicator_buffers   5
#property indicator_color1    LightBlue
#property indicator_color2    Tomato
#property indicator_color3    Aqua
#property indicator_color4    Orange
#property indicator_color5    Goldenrod
#property indicator_width1    1
#property indicator_width2    1
#property indicator_width3    1
#property indicator_width4    1
#property indicator_width5    1
#property indicator_style3    3
#property indicator_style4    3

//---- input parameters
extern int TimeFrame=0;
extern int       Mode =  0; // 0-RSI method; 1-Stoch method
extern string note1 = "Level:1-77;Mode:RSI1;Stoch2;ADX3";
extern int       Length = 10; // Period
extern int       Smooth =  5; // Period of smoothing
extern int       Signal =  5; // Period of Signal Line
extern int       Price  =  0; // Price mode : 0-Close,1-Open,2-High,3-Low,4-Median,5-Typical,6-Weighted
extern int       ModeMA =  3; // Mode of Moving Average: SMA0,EMA1,SmdMA2,LWMA3
extern string note2 = "Price(OCHLMTF)ModeMa(SMA0,EMA1,SmmMA2,LWMA3";
extern string note3 = "YellowDots-NoTradeZone,Bulls&BearsDown";

/*************************************************************************
PERIOD_M1   1
PERIOD_M5   5
PERIOD_M15  15
PERIOD_M30  30
PERIOD_H1   60
PERIOD_H4   240
PERIOD_D1   1440
PERIOD_W1   10080
PERIOD_MN1  43200
You must use the numeric value of the timeframe that you want to use
when you set the TimeFrame' value with the indicator inputs.
---------------------------------------
MODE_SMA    0 Simple moving average,
MODE_EMA    1 Exponential moving average,
MODE_SMMA   2 Smoothed moving average,
MODE_LWMA   3 Linear weighted moving average.
You must use the numeric value of the MA Method that you want to use
when you set the 'ma_method' value with the indicator inputs.

**********************************************************/

//---- buffers
double Bulls[];
double Bears[];
double AvgBulls[];
double AvgBears[];
double SmthBulls[];
double SmthBears[];
double SigBulls[];
double SigBears[];
double SigNoTrade[];
double SmthBears1[];
double SigBears1[];
double SmthBulls1[];
double SigBulls1[];
//+------------------------------------------------------------------+
//| Custom indicator initialization function                         |
//+------------------------------------------------------------------+
int init()
  {
//---- indicators
 //  IndicatorBuffers(8);
   SetIndexStyle(0,DRAW_HISTOGRAM);
   SetIndexBuffer(0,SmthBulls);
   SetIndexStyle(1,0);
   SetIndexBuffer(1,SmthBears);
   SetIndexStyle(2,DRAW_LINE);
   SetIndexBuffer(2,SigBulls);
   SetIndexStyle(3,DRAW_LINE);
   SetIndexBuffer(3,SigBears);
    SetIndexBuffer(4,SigNoTrade);
  SetIndexStyle(4,DRAW_ARROW);
 SetIndexArrow(4,159);
//    SetIndexEmptyValue(4,EMPTY_VALUE);
//---- name for DataWindow and indicator subwindow label
   string short_name="MTF_AbsStrDHs["+TimeFrame+"]"+Mode+","+Length+","+Smooth+","+Signal+","+ModeMA+")";
   IndicatorShortName(short_name);
   SetIndexLabel(0,"Bulls; tf("+TimeFrame+")");
   SetIndexLabel(1,"Bears; tf("+TimeFrame+")");
   SetIndexLabel(2,"SignalBulls; tf("+TimeFrame+")");
   SetIndexLabel(3,"SignalBears; tf("+TimeFrame+")");
   SetIndexLabel(4,"AS_NoTrade("+TimeFrame+")");

//----
   SetIndexDrawBegin(0,Length+Smooth+Signal);
   SetIndexDrawBegin(1,Length+Smooth+Signal);
   SetIndexDrawBegin(2,Length+Smooth+Signal);
   SetIndexDrawBegin(3,Length+Smooth+Signal);
//---- name for DataWindow and indicator subwindow label
   switch(TimeFrame)
   {
      case 1 : string TimeFrameStr="Period_M1"; break;
      case 5 : TimeFrameStr="Period_M5"; break;
      case 15 : TimeFrameStr="Period_M15"; break;
      case 30 : TimeFrameStr="Period_M30"; break;
      case 60 : TimeFrameStr="Period_H1"; break;
      case 240 : TimeFrameStr="Period_H4"; break;
      case 1440 : TimeFrameStr="Period_D1"; break;
      case 10080 : TimeFrameStr="Period_W1"; break;
      case 43200 : TimeFrameStr="Period_MN1"; break;
      default : TimeFrameStr="Current Timeframe";
  }
   return(0);
  }
//+------------------------------------------------------------------+
//| MTF                                                              |
//+------------------------------------------------------------------+
int start()
  {
   datetime TimeArray[];
   int    i,limit,y=0,counted_bars=IndicatorCounted();

// Plot defined time frame on to current time frame
   ArrayCopySeries(TimeArray,MODE_TIME,Symbol(),TimeFrame);

   limit=Bars-counted_bars+TimeFrame/Period();
   for(i=0,y=0;i<limit;i++)
   {
   if (Time[i]<TimeArray[y]) y++;

/***********************************************************
   Add your main indicator loop below.  You can reference an existing
      indicator with its iName  or iCustom.
   Rule 1:  Add extern inputs above for all neccesary values
   Rule 2:  Use 'TimeFrame' for the indicator time frame
   Rule 3:  Use 'y' for your indicator's shift value
 **********************************************************/

   SmthBulls[i]=iCustom(NULL,TimeFrame,"AbsoluteStrength_v1DH",Mode,Length,Smooth,Signal,Price,ModeMA,0,y);
   SmthBears[i]=iCustom(NULL,TimeFrame,"AbsoluteStrength_v1DH",Mode,Length,Smooth,Signal,Price,ModeMA,1,y);
   SigBulls[i]=iCustom(NULL,TimeFrame,"AbsoluteStrength_v1DH",Mode,Length,Smooth,Signal,Price,ModeMA,2,y);
   SigBears[i]=iCustom(NULL,TimeFrame,"AbsoluteStrength_v1DH",Mode,Length,Smooth,Signal,Price,ModeMA,3,y);

double SmthBulls1   =iCustom(NULL,TimeFrame,"AbsoluteStrength_v1.1",  Mode, Length,Smooth, Signal, Price, ModeMA,0,0,0,y);
double SmthBears1   =iCustom(NULL,TimeFrame,"AbsoluteStrength_v1.1",  Mode, Length,Smooth, Signal, Price, ModeMA,0,0,1,y);
double SigBulls1    =iCustom(NULL,TimeFrame,"AbsoluteStrength_v1.1",  Mode, Length,Smooth, Signal, Price, ModeMA,0,0,2,y);
double SigBears1    =iCustom(NULL,TimeFrame,"AbsoluteStrength_v1.1",  Mode, Length,Smooth, Signal, Price, ModeMA,0,0,3,y);

    SigNoTrade[i] = EMPTY_VALUE;
 if(SmthBulls1< SigBulls1 && SmthBears1 < SigBears1) SigNoTrade[i] = 0;
   }
//
    //----  Refresh buffers ++++++++++++++++++++ upgrade by Raff
     int TimeFrame;   if (TimeFrame>Period()) {
     int PerINT=TimeFrame/Period()+1;
     datetime TimeArr[]; ArrayResize(TimeArr,PerINT);
     ArrayCopySeries(TimeArr,MODE_TIME,Symbol(),Period());
     for(i=0;i<PerINT+1;i++) {if (TimeArr[i]>=TimeArray[0]) {
 /********************************************************
    Refresh buffers:         buffer[i] = buffer[0];
 ********************************************************/

      SmthBulls[i] = SmthBulls[0];
      SmthBears[i] = SmthBears[0];
      SigBulls[i] = SigBulls[0];
      SigBears[i] = SigBears[0];
      SigNoTrade[i]= SigNoTrade[0];
 //--
   } } }
//+++++++++++++++++++++++++++++++++++++++++++++++++++  Raff

   return(0);
  }
//+-----------
Comments