MTF_ang_AZad_C[sw]
Download script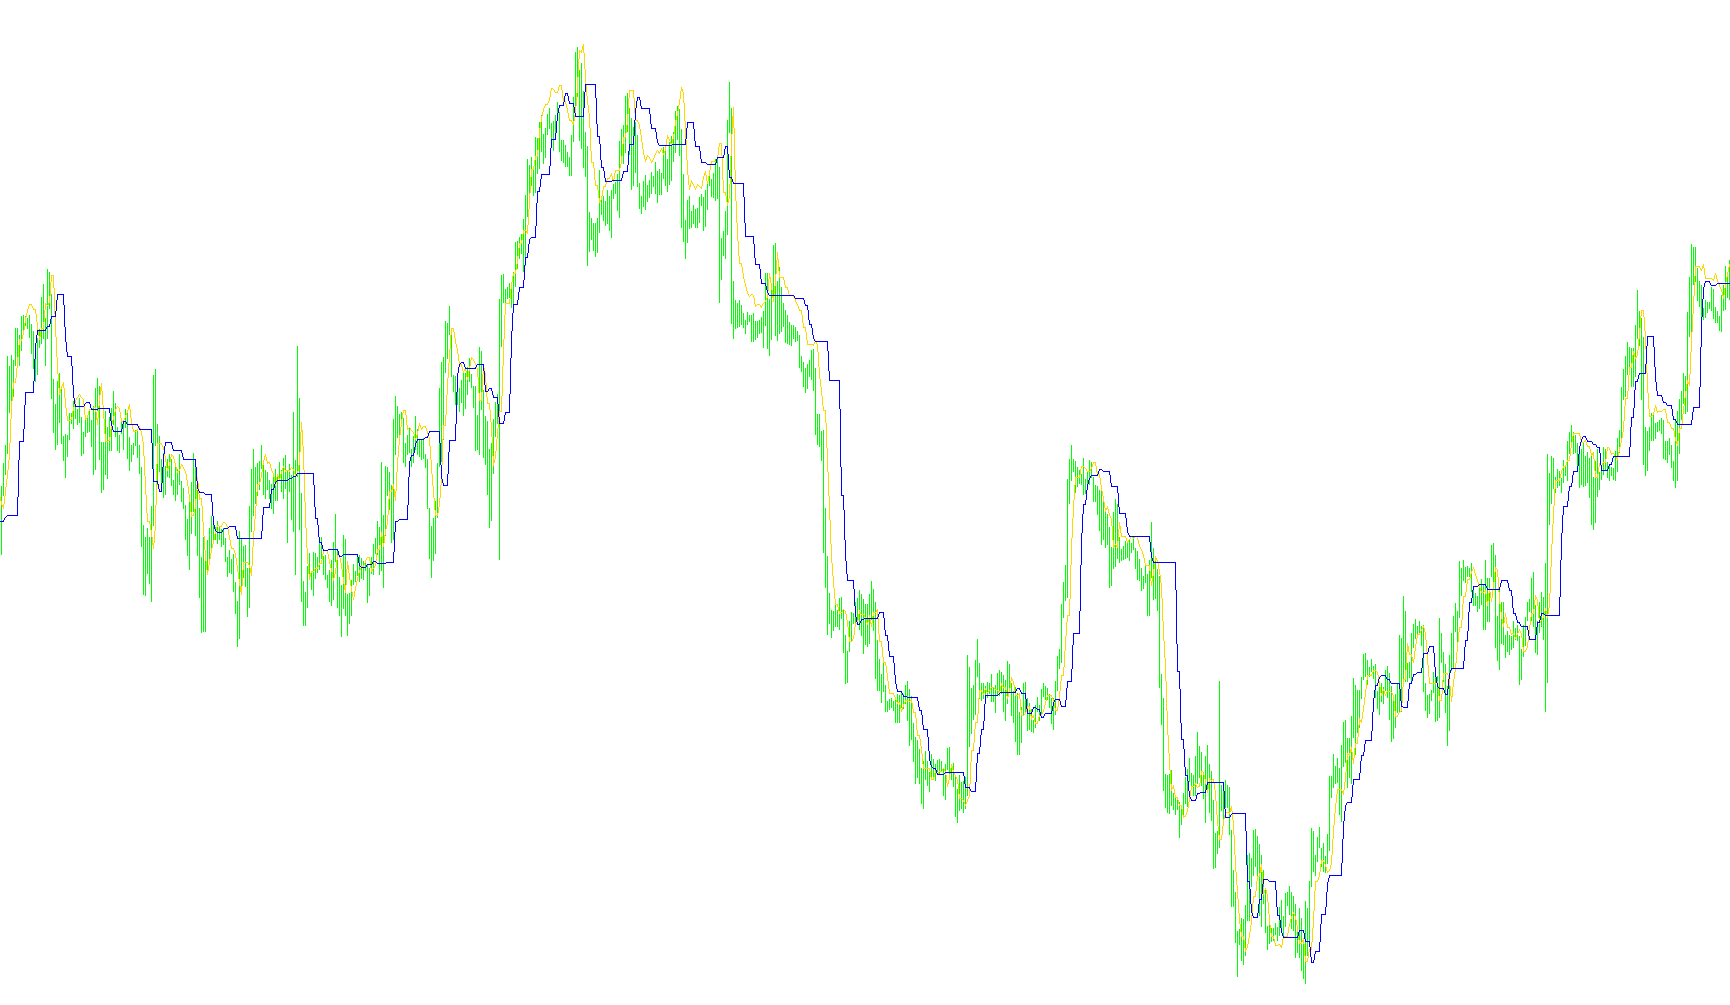
This technical script is designed as a Multi-Timeframe (MTF) analytical tool for the MetaTrader platform. Its primary purpose is to allow traders to visualize data from a higher time scale (such as a 4-hour chart) while they are currently viewing a smaller, more detailed time frame (such as a 15-minute chart).
Core Functionality
The logic follows a "data embedding" approach. Instead of forcing the user to switch back and forth between different charts to see broader trends, this script pulls specific calculations from an external base indicator—specifically the "ang_AZad_Css" tool—and projects them onto the current view.
How It Works
- Timeframe Synchronization: The script identifies a target timeframe (defined by the user). It then aligns the data from that higher timeframe with the price movements on your current screen, ensuring that the information remains synchronized and relevant to the current candles.
- Dual-Line Visualization: The logic processes two distinct sets of data points simultaneously. These are represented as two separate lines on a dedicated sub-window below the main price chart.
- Line 1: Reflects a primary calculation based on a specific "Shift" parameter.
- Line 2: Reflects a secondary calculation adjusted by an additional "zShift" offset.
- Dynamic Offsetting: To ensure clarity, the script applies mathematical shifts to both lines. This prevents the data from overlapping confusingly and helps in visually distinguishing between the two different analytical perspectives being provided.
- Automated Data Fetching: The script works by looping through the historical price data of the current chart and "calling" the necessary values from the external source for every bar. This ensures that as new price data arrives, the multi-timeframe lines update automatically in real-time.
Summary for the User
In simple terms, this tool acts as a bridge. It allows you to see the "big picture" trends of a larger timeframe without losing sight of the immediate price action on your current chart. By monitoring the two resulting lines, traders can better understand where the broader market is moving relative to their immediate trading environment.
//+------------------------------------------------------------------+
//|                 MTF_ang_AZad(C)[sw]          ang_Zad(C).mq4  ik  |
//|     www.forex-tsd.com     Copyright © 2006, ANG3110@latchess.com |
//+------------------------------------------------------------------+

#property  copyright "ANG3110@latchess.com"
//----
#property indicator_separate_window
#property indicator_buffers 2
#property indicator_color1 Indigo
#property indicator_color2 DarkSlateBlue
//----
extern int TimeFrame=0;
extern int ki = 2;
extern int Shift=1;
extern int zShift=1;

double ExtMapBuffer1[];
double ExtMapBuffer2[];


int init()
  {
   if(TimeFrame==0) TimeFrame = Period();
   SetIndexBuffer(0, ExtMapBuffer1);
   SetIndexStyle(0,DRAW_LINE);
   SetIndexShift( 0, Shift*TimeFrame/Period());
   SetIndexDrawBegin(0, Shift-1);
   SetIndexBuffer(1, ExtMapBuffer2);
   SetIndexStyle(1,DRAW_LINE);
   SetIndexDrawBegin(1, Shift+zShift-1);
   SetIndexShift(1, (Shift+zShift)*TimeFrame/Period());
   SetIndexLabel(0,"MTF_ang_AZad(C)Z"+ki+"TF"+TimeFrame+"s"+Shift+"");
   SetIndexLabel(1,"MTF_ang_AZad(C)Z2"+ki+"TF"+TimeFrame+"zs"+zShift+"");

   return(0);
  }
//+------------------------------------------------------------------+
//| Custom indicator start function                                  |
//+------------------------------------------------------------------+
int start()

  {
   datetime TimeArray[];
   int    i,shift,limit,y=0,counted_bars=IndicatorCounted();

   ArrayCopySeries(TimeArray,MODE_TIME,Symbol(),TimeFrame);

   limit=Bars-counted_bars+TimeFrame/Period();
   for(i=0,y=0;i<limit;i++) {
     if (Time[i]<TimeArray[y]) {y++;}
     ExtMapBuffer1[i]=iCustom(NULL,TimeFrame,"ang_AZad_Css[sw]",ki,Shift,0,y);
     ExtMapBuffer2[i]=iCustom(NULL,TimeFrame,"ang_AZad_Css[sw]",ki,Shift,zShift,1,y);
   }
   return(0);
  }


//+------------------------------------------------------------------+
Comments