MTF_FractalChannel_v1
Download script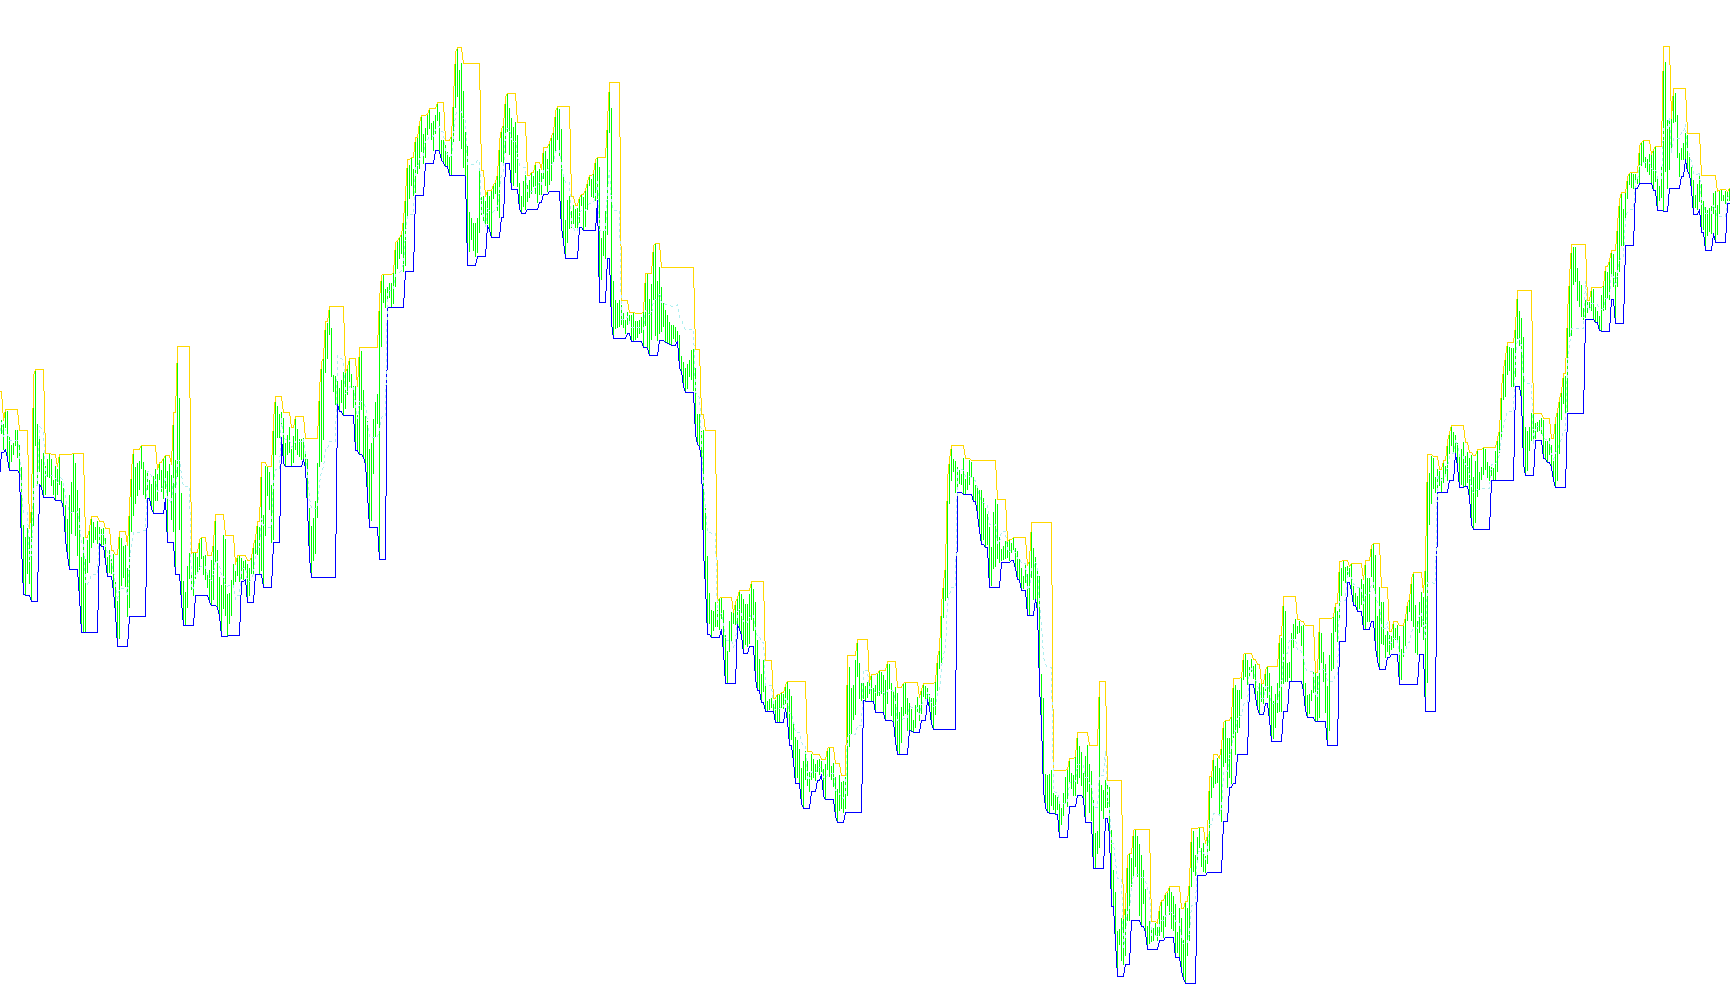
This tool is designed to provide traders with a visual representation of market structure by identifying and drawing specific price channels based on "fractal" price action. Essentially, it helps map out the significant boundaries of the market to identify where trends might be moving and where they may encounter resistance or support.
Core Functionality
The script works by analyzing historical price data to detect key structural points (fractals). Instead of simply drawing lines based on every small movement in the market, it looks for broader patterns to establish a "channel." This channel is composed of three distinct components displayed on your chart:
- Up Channel: Represents the upper boundary of the market structure.
- Down Channel: Represents the lower boundary of the market structure.
- Middle Channel: Provides a central reference point, helping traders identify the "equilibrium" or center of the current price movement.
Multi-Timeframe Analysis
One of the most important features of this logic is its ability to perform Multi-Timeframe (MTF) analysis. This means that even if you are looking at a small, fast-moving chart (like a 5-minute chart), the script can be configured to pull and display the channel data from a much larger timeframe (such as an hour or a day).
By doing this, it allows you to see the "big picture" trends while making decisions on smaller timeframes. It automatically synchronizes the larger timeframe's structural data with your current view, ensuring that the channels displayed are relevant to the broader market context.
User Customization
The logic includes several adjustable parameters to tailor the visual experience to your specific trading style:
- TimeFrame: Allows you to select which higher timeframe the channel should be based on.
- Channel Type and Mode: These settings define how the mathematical calculations for the channels are performed, allowing you to choose the specific "flavor" of fractal detection that suits your strategy.
- Margins and Shift: These provide fine-tuning options to adjust the distance or positioning of the lines on the chart, ensuring they align perfectly with your visual preferences.
Summary
In short, this script acts as a structural overlay. It filters out the "noise" of minor price fluctuations to show you the dominant path the market is taking, providing a clear visual map of support and resistance boundaries derived from multiple timeframes simultaneously.
//+------------------------------------------------------------------+
//|                                        MTF_FractalChannel_v1.mq4 |
//|                                Copyright © 2006, TrendLaboratory |
//|            http://finance.groups.yahoo.com/group/TrendLaboratory |
//|                                   E-mail: igorad2003@yahoo.co.uk |
//+------------------------------------------------------------------+
#property copyright "Copyright © 2006, TrendLaboratory"
#property link      "http://finance.groups.yahoo.com/group/TrendLaboratory"

#property indicator_chart_window
#property indicator_buffers 3
#property indicator_color1 LightBlue
#property indicator_color2 Tomato
#property indicator_color3 Yellow
#property indicator_width1 2
#property indicator_width2 2
//---- input parameters
extern int     TimeFrame   = 0;
extern int     ChannelType = 1;
extern double  Margins     = 0;
extern int     Shift       = 0;
extern int     Mode        = 0;

//---- buffers
double UpBuffer[];
double DnBuffer[];
double MdBuffer[];

//+------------------------------------------------------------------+
//| Custom indicator initialization function                         |
//+------------------------------------------------------------------+
int init()
  {
   string short_name;
//---- indicator line
   SetIndexStyle(0,DRAW_LINE);
   SetIndexStyle(1,DRAW_LINE);
   SetIndexStyle(2,DRAW_LINE,2);
   SetIndexBuffer(0,UpBuffer);
   SetIndexBuffer(1,DnBuffer);
   SetIndexBuffer(2,MdBuffer);
//---- name for DataWindow and indicator subwindow label
   short_name="MTF FractalChannel("+ChannelType+")";
   IndicatorShortName(short_name);
   SetIndexLabel(0,"Up Channel");
   SetIndexLabel(1,"Down Channel");
   SetIndexLabel(2,"Middle Channel");

   SetIndexShift(0,Shift);
   SetIndexShift(1,Shift);
   SetIndexShift(2,Shift);
//----
   SetIndexDrawBegin(0,2*ChannelType);
   SetIndexDrawBegin(1,2*ChannelType);
   SetIndexDrawBegin(2,2*ChannelType);
//----
   return(0);
  }
//+------------------------------------------------------------------+
//| FractalChannel_v3.1                                                |
//+------------------------------------------------------------------+
int start()
{
   datetime TimeArray[];
   int      i,limit,y=0,counted_bars=IndicatorCounted();

// Plot defined time frame on to current time frame
   ArrayCopySeries(TimeArray,MODE_TIME,Symbol(),TimeFrame);

   limit=Bars-counted_bars+TimeFrame/Period();
   for(i=0,y=0;i<limit;i++)
   {
   if (Time[i]<TimeArray[y]) y++;

	UpBuffer[i] = iCustom(NULL,TimeFrame,"FractalChannel_v4",ChannelType,Margins,Shift,Mode,0,y);
   DnBuffer[i] = iCustom(NULL,TimeFrame,"FractalChannel_v4",ChannelType,Margins,Shift,Mode,1,y);
   MdBuffer[i] = iCustom(NULL,TimeFrame,"FractalChannel_v4",ChannelType,Margins,Shift,Mode,2,y);
	}
return(0);
}
Comments