This script is designed to display a moving average line on your chart, but with a few key differences from a standard moving average indicator. It allows you to see a moving average calculated from a different timeframe than the one you're currently viewing on your chart, and it color-codes the line to show whether the moving average is trending up or down.
Here's a breakdown:
-
Moving Average Calculation: The core of the script is calculating a moving average. A moving average is a way to smooth out price data by averaging the price over a certain period. This script lets you choose which type of moving average to use (Simple, Exponential, Smoothed, Linear Weighted, Least Squares, Ehlers Itrend, HMA, or NonLag), and the period over which it's calculated (e.g., 14 periods). You can also specify which price to use (e.g., close, open, high, low, or a combination).
-
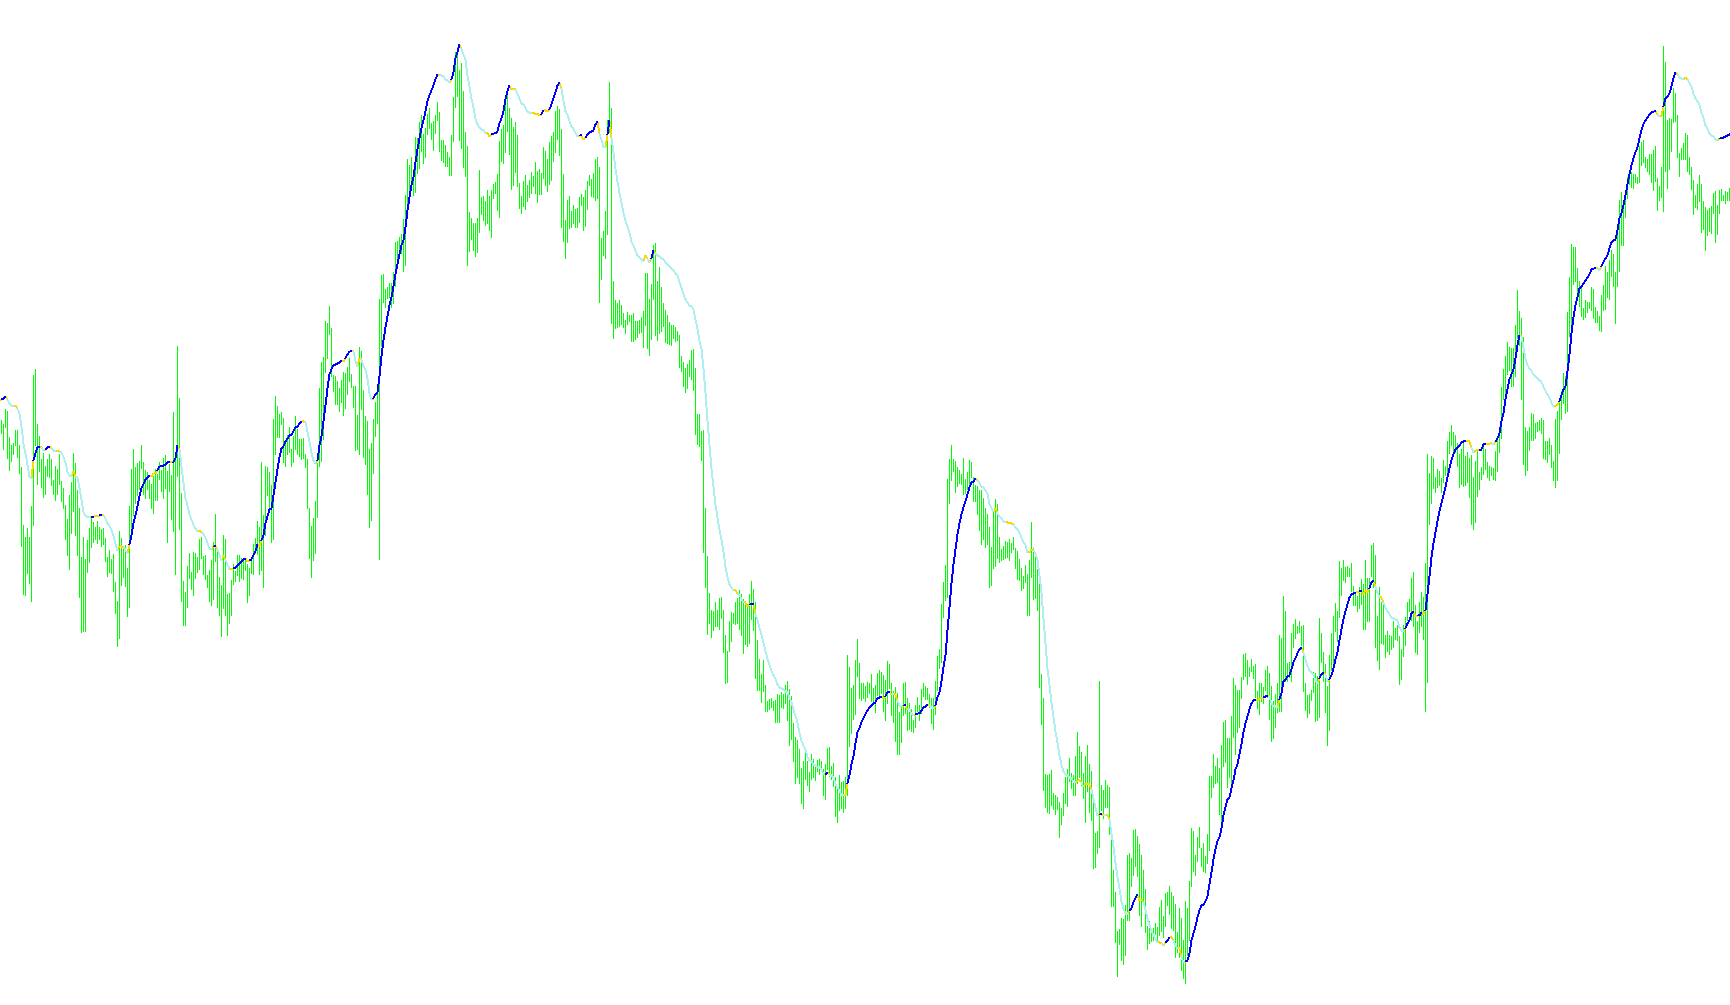
Multi-Timeframe Analysis: The most important feature is that the moving average can be calculated on a different timeframe than the chart you are currently viewing. For example, you could be looking at a 15-minute chart but display a moving average calculated from hourly data. This allows you to see longer-term trends on a shorter-term chart.
-
Color-Coding: The moving average line is displayed in three colors (Yellow, Green, Red) to give you an immediate visual cue about the trend. The script compares the current value of the moving average to its previous value. If the moving average has increased from the previous period, the line is colored green. If it has decreased, the line is colored red. If the value is the same as the previous period, the color line is yellow. This makes it easy to quickly see whether the moving average is trending up or down.
-
How it Works: The script works by looking back over the specified number of periods on the chosen timeframe, calculating the moving average for each point in time, and then drawing the line on your current chart. The color of the line at each point is determined by comparing the current moving average value to the previous one.
In simple terms, this script is like having a special moving average that tells you the trend direction (up or down) at a glance, and it can do so based on a longer-term view than what you're currently looking at on your chart.
//+------------------------------------------------------------------+
//|                                            MTF_MA_In_Color.mq4   |
//|                      Copyright © 2004, MetaQuotes Software Corp. |
//| Modified from MTF_LSMA_In_Color to use any MA by Robert Hill     |
//| Added use of Applied Price by Robert Hill                        |
//| Thanks to David Honeywell for MTF code                           |
//+------------------------------------------------------------------+
#property  copyright "Copyright © 2006, FX Sniper and Robert Hill"
#property  link      "http://www.metaquotes.net/"

#define LSMA 4
#define ITREND 5
#define HMA 6
#define NONLAG 7

//---- indicator settings

#property  indicator_separate_window
#property  indicator_buffers 3
#property indicator_color1 Yellow
#property indicator_color2 Green
#property indicator_color3 Red

//---- buffers

double ExtMapBuffer1[];
double ExtMapBuffer2[];
double ExtMapBuffer3[];

//---- input parameters
/*************************************************************************
PERIOD_M1   1
PERIOD_M5   5
PERIOD_M15  15
PERIOD_M30  30
PERIOD_H1   60
PERIOD_H4   240
PERIOD_D1   1440
PERIOD_W1   10080
PERIOD_MN1  43200
You must use the numeric value of the timeframe that you want to use
when you set the 'TimeFrame' value with the indicator inputs.
---------------------------------------
MODE_SMA    0 Simple moving average,
MODE_EMA    1 Exponential moving average,
MODE_SMMA   2 Smoothed moving average,
MODE_LWMA   3 Linear weighted moving average.
LSMA        4 Least Squares Moving Average (linreg)
You must use the numeric value of the MA Mode that you want to use
when you set the 'ma_mode' value with the indicator inputs.
**************************************************************************/
extern int       TimeFrame=0;
extern int       MAPeriod=14;
extern string dstr0 = " Moving Average Mode";
extern string dstr1 = " 0 = SMA";
extern string dstr2 = " 1 = EMA";
extern string dstr3 = " 2 = SMMA";
extern string dstr4 = " 3 = LWMA";
extern string dstr5 = " 4 = LSMA";
extern string dstr6 = " 5 = Ehlers Itrend";
extern string dstr7 = " 6 = HMA";
extern string dstr8 = " 7 = NonLag";
extern int       MA_Mode=1;
extern string  p = "--Applied Price Types--";
extern string  p0 = " 0 = close";
extern string  p1 = " 1 = open";
extern string  p2 = " 2 = high";
extern string  p3 = " 3 = low";
extern string  p4 = " 4 = median(high+low)/2";
extern string  p5 = " 5 = typical(high+low+close)/3";
extern string  p6 = " 6 = weighted(high+low+close+close)/4";
extern int       MAAppliedPrice = 0;//0=close, 1=open, 2=high, 3=low, 4=median(high+low)/2, 5=typical(high+low+close)/3, 6=weighted(high+low+close+close)/4
extern int Draw4HowLongg = 1500;

//---- variables

int    MAMode;
string strMAType;


//+------------------------------------------------------------------+
//| Custom indicator initialization function                         |
//+------------------------------------------------------------------+
int init()
  {
//   IndicatorBuffers(3);

//---- drawing settings
   SetIndexBuffer(2,ExtMapBuffer1);
   SetIndexBuffer(1,ExtMapBuffer2);
   SetIndexBuffer(0,ExtMapBuffer3);

   SetIndexStyle(2,DRAW_LINE,STYLE_SOLID,2);
   SetIndexStyle(1,DRAW_LINE,STYLE_SOLID,2);
   SetIndexStyle(0,DRAW_LINE,STYLE_SOLID,2);

//---- name for DataWindow and indicator subwindow label
   switch(TimeFrame)
   {
      case 1 : string TimeFrameStr="Period_M1"; break;
      case 5 : TimeFrameStr="Period_M5"; break;
      case 15 : TimeFrameStr="Period_M15"; break;
      case 30 : TimeFrameStr="Period_M30"; break;
      case 60 : TimeFrameStr="Period_H1"; break;
      case 240 : TimeFrameStr="Period_H4"; break;
      case 1440 : TimeFrameStr="Period_D1"; break;
      case 10080 : TimeFrameStr="Period_W1"; break;
      case 43200 : TimeFrameStr="Period_MN1"; break;
      default : TimeFrameStr="Current Timeframe";
   }

   switch (MA_Mode)
   {
      case 1: strMAType="EMA"; MAMode=MODE_EMA; break;
      case 2: strMAType="SMMA"; MAMode=MODE_SMMA; break;
      case 3: strMAType="LWMA"; MAMode=MODE_LWMA; break;
      case LSMA: strMAType="LSMA"; break;
      case ITREND: strMAType="ITrend";break;
      case HMA: strMAType="HMA";break;
      case NONLAG: strMAType="NonLag";break;
      default: strMAType="SMA"; MAMode=MODE_SMA; break;
   }
   IndicatorShortName( "MTF_" + strMAType+ " (" +MAPeriod + ") " + "-("+TimeFrameStr+")");
//---- initialization done
   return(0);
  }

//+------------------------------------------------------------------+
//| LSMA with PriceMode                                              |
//| PrMode  0=close, 1=open, 2=high, 3=low, 4=median(high+low)/2,    |
//| 5=typical(high+low+close)/3, 6=weighted(high+low+close+close)/4  |
//+------------------------------------------------------------------+

double fLSMA(int iTimeFrame,int Rperiod, int prMode, int mshift)
{
   int i;
   double sum, price;
   int length;
   double lengthvar;
   double tmp;
   double wt;

   length = Rperiod;

   sum = 0;
   for(i = length; i >= 1  ; i--)
   {
     lengthvar = length + 1;
     lengthvar /= 3;
     tmp = 0;
     switch (prMode)
     {
     case 0: price = iClose(NULL,iTimeFrame,length-i+mshift);break;
     case 1: price = iOpen(NULL,iTimeFrame,length-i+mshift);break;
     case 2: price = iHigh(NULL,iTimeFrame,length-i+mshift);break;
     case 3: price = iLow(NULL,iTimeFrame,length-i+mshift);break;
     case 4: price = (iHigh(NULL,iTimeFrame,length-i+mshift) + iLow(NULL,iTimeFrame,length-i+mshift))/2;break;
     case 5: price = (iHigh(NULL,iTimeFrame,length-i+mshift) + iLow(NULL,iTimeFrame,length-i+mshift) + iClose(NULL,iTimeFrame,length-i+mshift))/3;break;
     case 6: price = (iHigh(NULL,iTimeFrame,length-i+mshift) + iLow(NULL,iTimeFrame,length-i+mshift) + iClose(NULL,iTimeFrame,length-i+mshift) + iClose(NULL,iTimeFrame,length-i+mshift))/4;break;
     }
     tmp = ( i - lengthvar)*price;
     sum+=tmp;
    }
    wt = sum*6/(length*(length+1));

    return(wt);
}

int start()

  {
   datetime TimeArray[];

   double MA_Cur, MA_Prev;
   int i, limit, y=0;
   int counted_bars = IndicatorCounted();
   //---- check for possible errors
   if (counted_bars<0) return(-1);
   //---- last counted bar will be recounted
   if (counted_bars>0) counted_bars--;

// Plot defined time frame on to current time frame
   ArrayCopySeries(TimeArray,MODE_TIME,Symbol(),TimeFrame);

   limit = Bars - counted_bars; //counted_bars;

   for( i=0, y=0; i<limit; i++)
   {
     if (Time[i]<TimeArray[y]) y++;

/***********************************************************
   Add your main indicator loop below.  You can reference an existing
      indicator with its iName  or iCustom.
   Rule 1:  Add extern inputs above for all neccesary values
   Rule 2:  Use 'TimeFrame' for the indicator time frame
   Rule 3:  Use 'y' for your indicator's shift value
 **********************************************************/


//========== COLOR CODING ===========================================


     switch (MA_Mode)
     {

     case LSMA :
        MA_Cur = fLSMA(TimeFrame,MAPeriod, MAAppliedPrice,y);
        MA_Prev = fLSMA(TimeFrame,MAPeriod, MAAppliedPrice,y+1);
        break;
     case ITREND :
        MA_Cur=iCustom(NULL,TimeFrame,"Ehlers_iTrend",MAPeriod,0,y);
        MA_Prev=iCustom(NULL,TimeFrame,"Ehlers_iTrend",MAPeriod,0,y+1);
        break;
     case HMA :
        MA_Cur=iCustom(NULL,TimeFrame,"HMA2",MAPeriod,0,y);
        MA_Prev=iCustom(NULL,TimeFrame,"HMA2",MAPeriod,0,y+1);
        break;
     case NONLAG :
        MA_Cur=iCustom(NULL,TimeFrame,"NonLagMA",MAAppliedPrice,MAPeriod,0,y);
        MA_Prev=iCustom(NULL,TimeFrame,"NonLagMA",MAAppliedPrice,MAPeriod,0,y+1);
        break;
     default :
        MA_Cur = iMA(NULL,TimeFrame,MAPeriod,0,MAMode, MAAppliedPrice,y);
        MA_Prev = iMA(NULL,TimeFrame,MAPeriod,0,MAMode, MAAppliedPrice,y+1);
     }

     MA_Cur = NormalizeDouble(MA_Cur,MarketInfo(Symbol(), MODE_DIGITS));
     MA_Prev = NormalizeDouble(MA_Prev,MarketInfo(Symbol(), MODE_DIGITS));

     ExtMapBuffer3[i] = MA_Cur; //red
     ExtMapBuffer2[i] = MA_Cur; //green
     ExtMapBuffer1[i] = MA_Cur; //yellow

     if (MA_Prev > MA_Cur)
     {
        ExtMapBuffer2[i] = EMPTY_VALUE;

     }
     else if (MA_Prev < MA_Cur)
     {
        ExtMapBuffer1[i] = EMPTY_VALUE; //-1 red/greem tight

     }
     else
     {

         ExtMapBuffer1[i]=EMPTY_VALUE;//EMPTY_VALUE;
         ExtMapBuffer2[i]=EMPTY_VALUE;//EMPTY_VALUE;
     }
   }

   return(0);
  }
//+------------------------------------------------------------------+
Comments