MTF_MAChnl810_Env_v1
Download script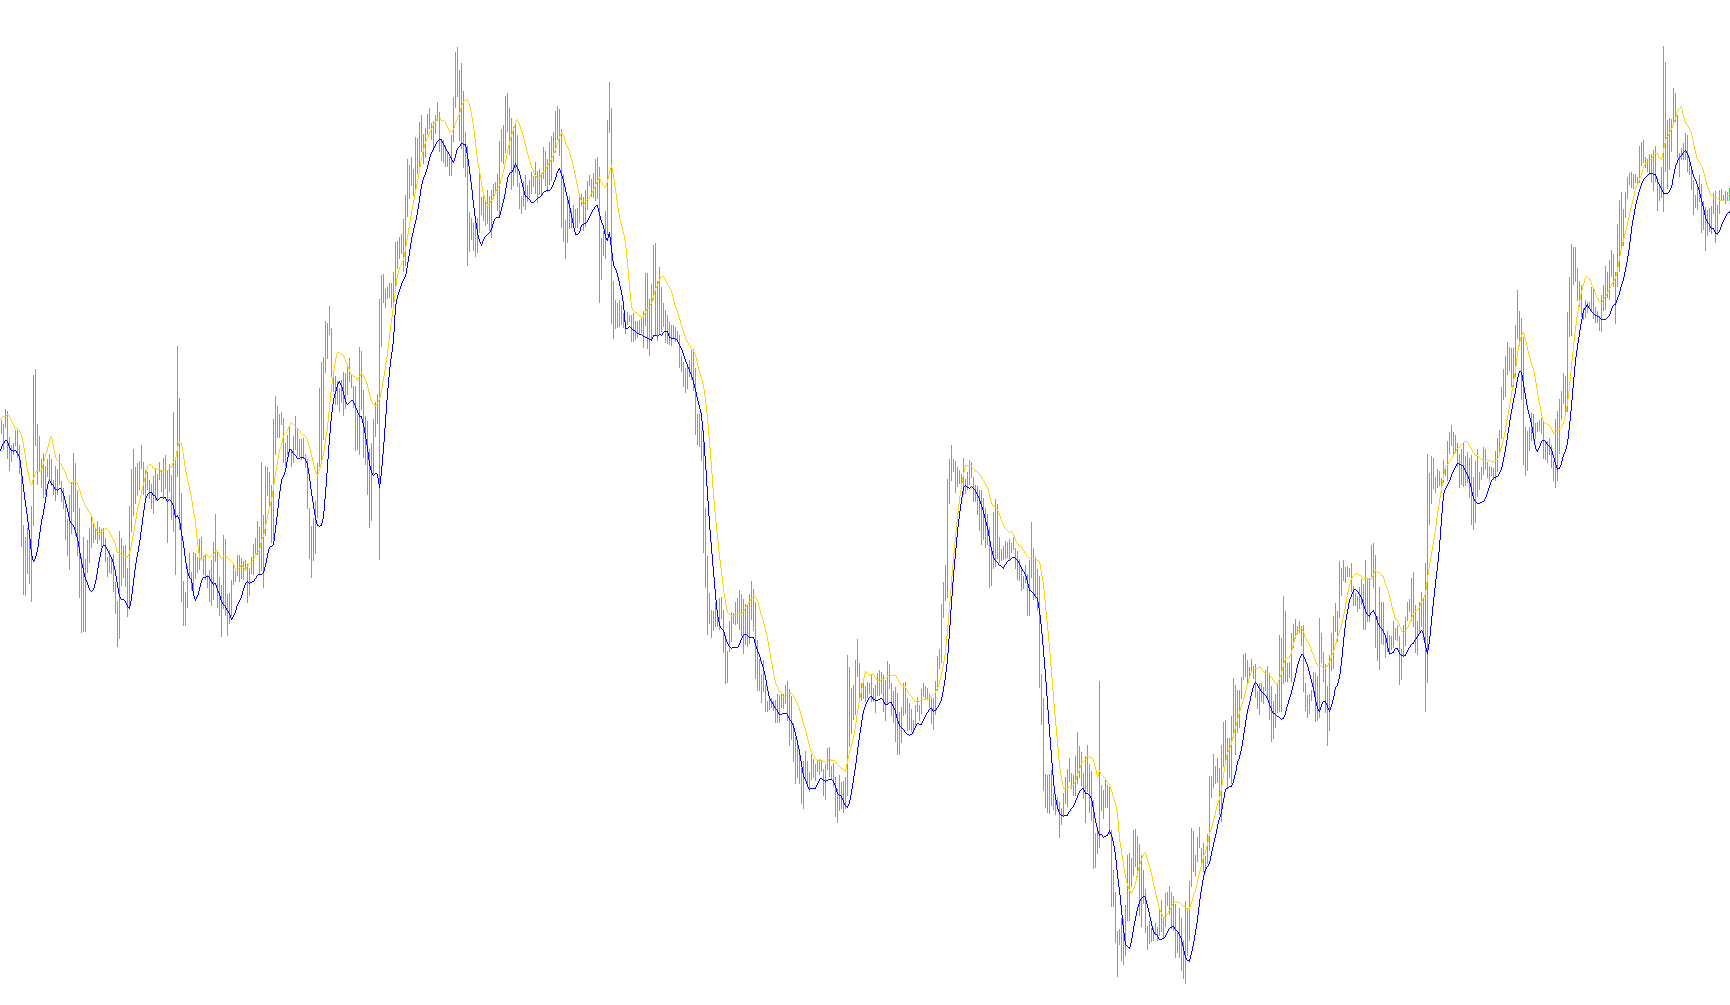
This script is a specialized financial analysis tool designed for the MetaTrader platform. It functions by generating a dynamic "channel" or "envelope" on a price chart, helping traders visualize potential boundaries and trends across different time scales simultaneously.
Core Functionality
The primary purpose of this tool is to project moving average data from a higher timeframe onto your current viewing screen. This allows you to keep an eye on broader market trends (like daily or hourly movements) without constantly switching back and forth between different charts.
How the Logic Works
1. Multi-Timeframe Integration The script is designed to "look ahead" at a larger timeframe than the one you are currently viewing. For example, if you are looking at 5-minute price action, the script can be configured to pull data from the 1-hour or Daily charts. It automatically aligns this historical data so that it maps correctly onto your current screen.
2. Dual Moving Average Calculation The tool operates using two distinct moving averages simultaneously:
- Upper Boundary: This calculates a high-position average based on specific price points (such as the "High" of each candle).
- Lower Boundary: This calculates a low-position average based on different price points (such as the "Low" of each candle).
Because these two averages use different periods and different price sources, they create a "channel" or an "envelope" around the current market price.
3. The Deviation Factor A key feature of this script is the Deviation setting. Instead of just drawing the raw moving averages, the logic applies a percentage-based expansion to them.
- The upper line is pushed outward by a specific percentage.
- The lower line is pulled inward by that same percentage.
This creates a "corridor" effect. When the market price remains within these two lines, it suggests the current trend is stable. When the price breaks outside of these boundaries, it may signal a significant shift in momentum or a potential reversal.
Summary for the User
In simple terms, this script draws a customized "trading lane" on your chart. By combining data from different timeframes and applying a percentage buffer to moving averages, it helps you visualize where the market is "supposed" to be trading based on broader trends, providing a clear visual guide for identifying support, resistance, and trend strength.
//+------------------------------------------------------------------+
//|                      MTF_MA_Channel810_Env; mod. Envelopes.mq4 ik|
//|                      Copyright © 2005, MetaQuotes Software Corp. |
//|                    www.forex-tsd.com;  http://www.metaquotes.net |
//+------------------------------------------------------------------+
#property copyright "Copyright © 2005, MetaQuotes Software Corp."
#property link      "http://www.metaquotes.net    www.forex-tsd.com"
//---- indicator settings
#property indicator_chart_window
#property indicator_buffers 2
//----
#property indicator_color1 RoyalBlue
#property indicator_color2 Maroon
#property indicator_width1 2
#property indicator_width2 2
//---- indicator parameters
extern int TimeFrame=0;
extern int MA_Hi_Period=10;
extern int MA_Hi_Method=0;
extern int MA_Hi_Price=2;
extern int MA_Lo_Period=8;
extern int MA_Lo_Method=0;
extern int MA_Lo_Price=3;
//extern int Channel_Shift=0;
extern int MA_Hi_Shift=0;
extern int MA_Lo_Shift=0;
extern double Deviation=0.0;
/*************************************************************************
PRICE_CLOSE    0 Close price.
PRICE_OPEN     1 Open price.
PRICE_HIGH     2 High price.
PRICE_LOW      3 Low price.
PRICE_MEDIAN   4 Median price, (high+low)/2.
PRICE_TYPICAL  5 Typical price, (high+low+close)/3.
PRICE_WEIGHTED 6 Weighted close price, (high+low+close+close)/4.
You must use the numeric value of the Applied Price that you want to use
when you set the 'applied_price' value with the indicator inputs.
---------------------------------------
MODE_SMA    0 Simple moving average,
MODE_EMA    1 Exponential moving average,
MODE_SMMA   2 Smoothed moving average,
MODE_LWMA   3 Linear weighted moving average.
You must use the numeric value of the MA Method that you want to use
when you set the 'ma_method' value with the indicator inputs.
**************************************************************************/
//---- indicator buffers
double ExtMapBuffer1[];
double ExtMapBuffer2[];
//----
int ExtCountedBars=0;
//+------------------------------------------------------------------+
//| Custom indicator initialization function                         |
//+------------------------------------------------------------------+
int init()
  {
   int    draw_begin;
   string short_name;
//---- drawing settings
   if(TimeFrame==0) TimeFrame=Period();
   SetIndexStyle(0,DRAW_LINE);
   SetIndexStyle(1,DRAW_LINE);
   SetIndexShift(0,MA_Hi_Shift*TimeFrame/Period());
   SetIndexShift(1,MA_Lo_Shift*TimeFrame/Period());
   IndicatorDigits(MarketInfo(Symbol(),MODE_DIGITS));
   if(MA_Hi_Period<2) MA_Hi_Period=10;
   if(MA_Lo_Period<2) MA_Lo_Period=8;
   draw_begin=MA_Hi_Period-1;
   draw_begin=MA_Lo_Period-1;
//---- indicator short name
   IndicatorShortName("MA_Channel("+MA_Hi_Period+","+MA_Lo_Period+" )");
   SetIndexLabel(0,"MA_C_Hi("+MA_Hi_Period+")tf"+TimeFrame+"");
   SetIndexLabel(1,"MA_C_Lo("+MA_Lo_Period+")tf"+TimeFrame+"");
   SetIndexDrawBegin(0,draw_begin);
   SetIndexDrawBegin(1,draw_begin);
//---- indicator buffers mapping
   SetIndexBuffer(0,ExtMapBuffer1);
   SetIndexBuffer(1,ExtMapBuffer2);
   if(Deviation<0) Deviation=0;
   if(Deviation>100.0) Deviation=100.0;
//---- name for DataWindow and indicator subwindow label
   switch(TimeFrame)
     {
      case 1 : string TimeFrameStr="Period_M1"; break;
      case 5 : TimeFrameStr="Period_M5"; break;
      case 15 : TimeFrameStr="Period_M15"; break;
      case 30 : TimeFrameStr="Period_M30"; break;
      case 60 : TimeFrameStr="Period_H1"; break;
      case 240 : TimeFrameStr="Period_H4"; break;
      case 1440 : TimeFrameStr="Period_D1"; break;
      case 10080 : TimeFrameStr="Period_W1"; break;
      case 43200 : TimeFrameStr="Period_MN1"; break;
      default : TimeFrameStr="Current Timeframe";
     }
//---- initialization done
   return(0);
  }
//+------------------------------------------------------------------+
//| MTF                                                              |
//+------------------------------------------------------------------+
int start()
  {
   datetime TimeArray[];
   int    i,limit,y=0,counted_bars=IndicatorCounted();
   // Plot defined time frame on to current time frame
   ArrayCopySeries(TimeArray,MODE_TIME,Symbol(),TimeFrame);
//----
   limit=Bars-counted_bars+TimeFrame/Period();
   for(i=0,y=0;i<limit;i++)
     {
      if (Time[i]<TimeArray[y]) y++;
/***********************************************************
   Add your main indicator loop below.  You can reference an existing
   indicator with its iName  or iCustom.
   Rule 1:  Add extern inputs above for all neccesary values
   Rule 2:  Use 'TimeFrame' for the indicator time frame
   Rule 3:  Use 'y' for your indicator's shift value
**********************************************************/
      //---- EnvelopesM counted in the buffers
      ExtMapBuffer1[i]=(1+Deviation/100)*iMA(NULL,TimeFrame,MA_Hi_Period,0,MA_Hi_Method,MA_Hi_Price,y);
      ExtMapBuffer2[i]=(1-Deviation/100)*iMA(NULL,TimeFrame,MA_Lo_Period,0,MA_Lo_Method,MA_Lo_Price,y);
     }
//---- done
   return(0);
  }
//+------------------------------------------------------------------+
Comments